Process
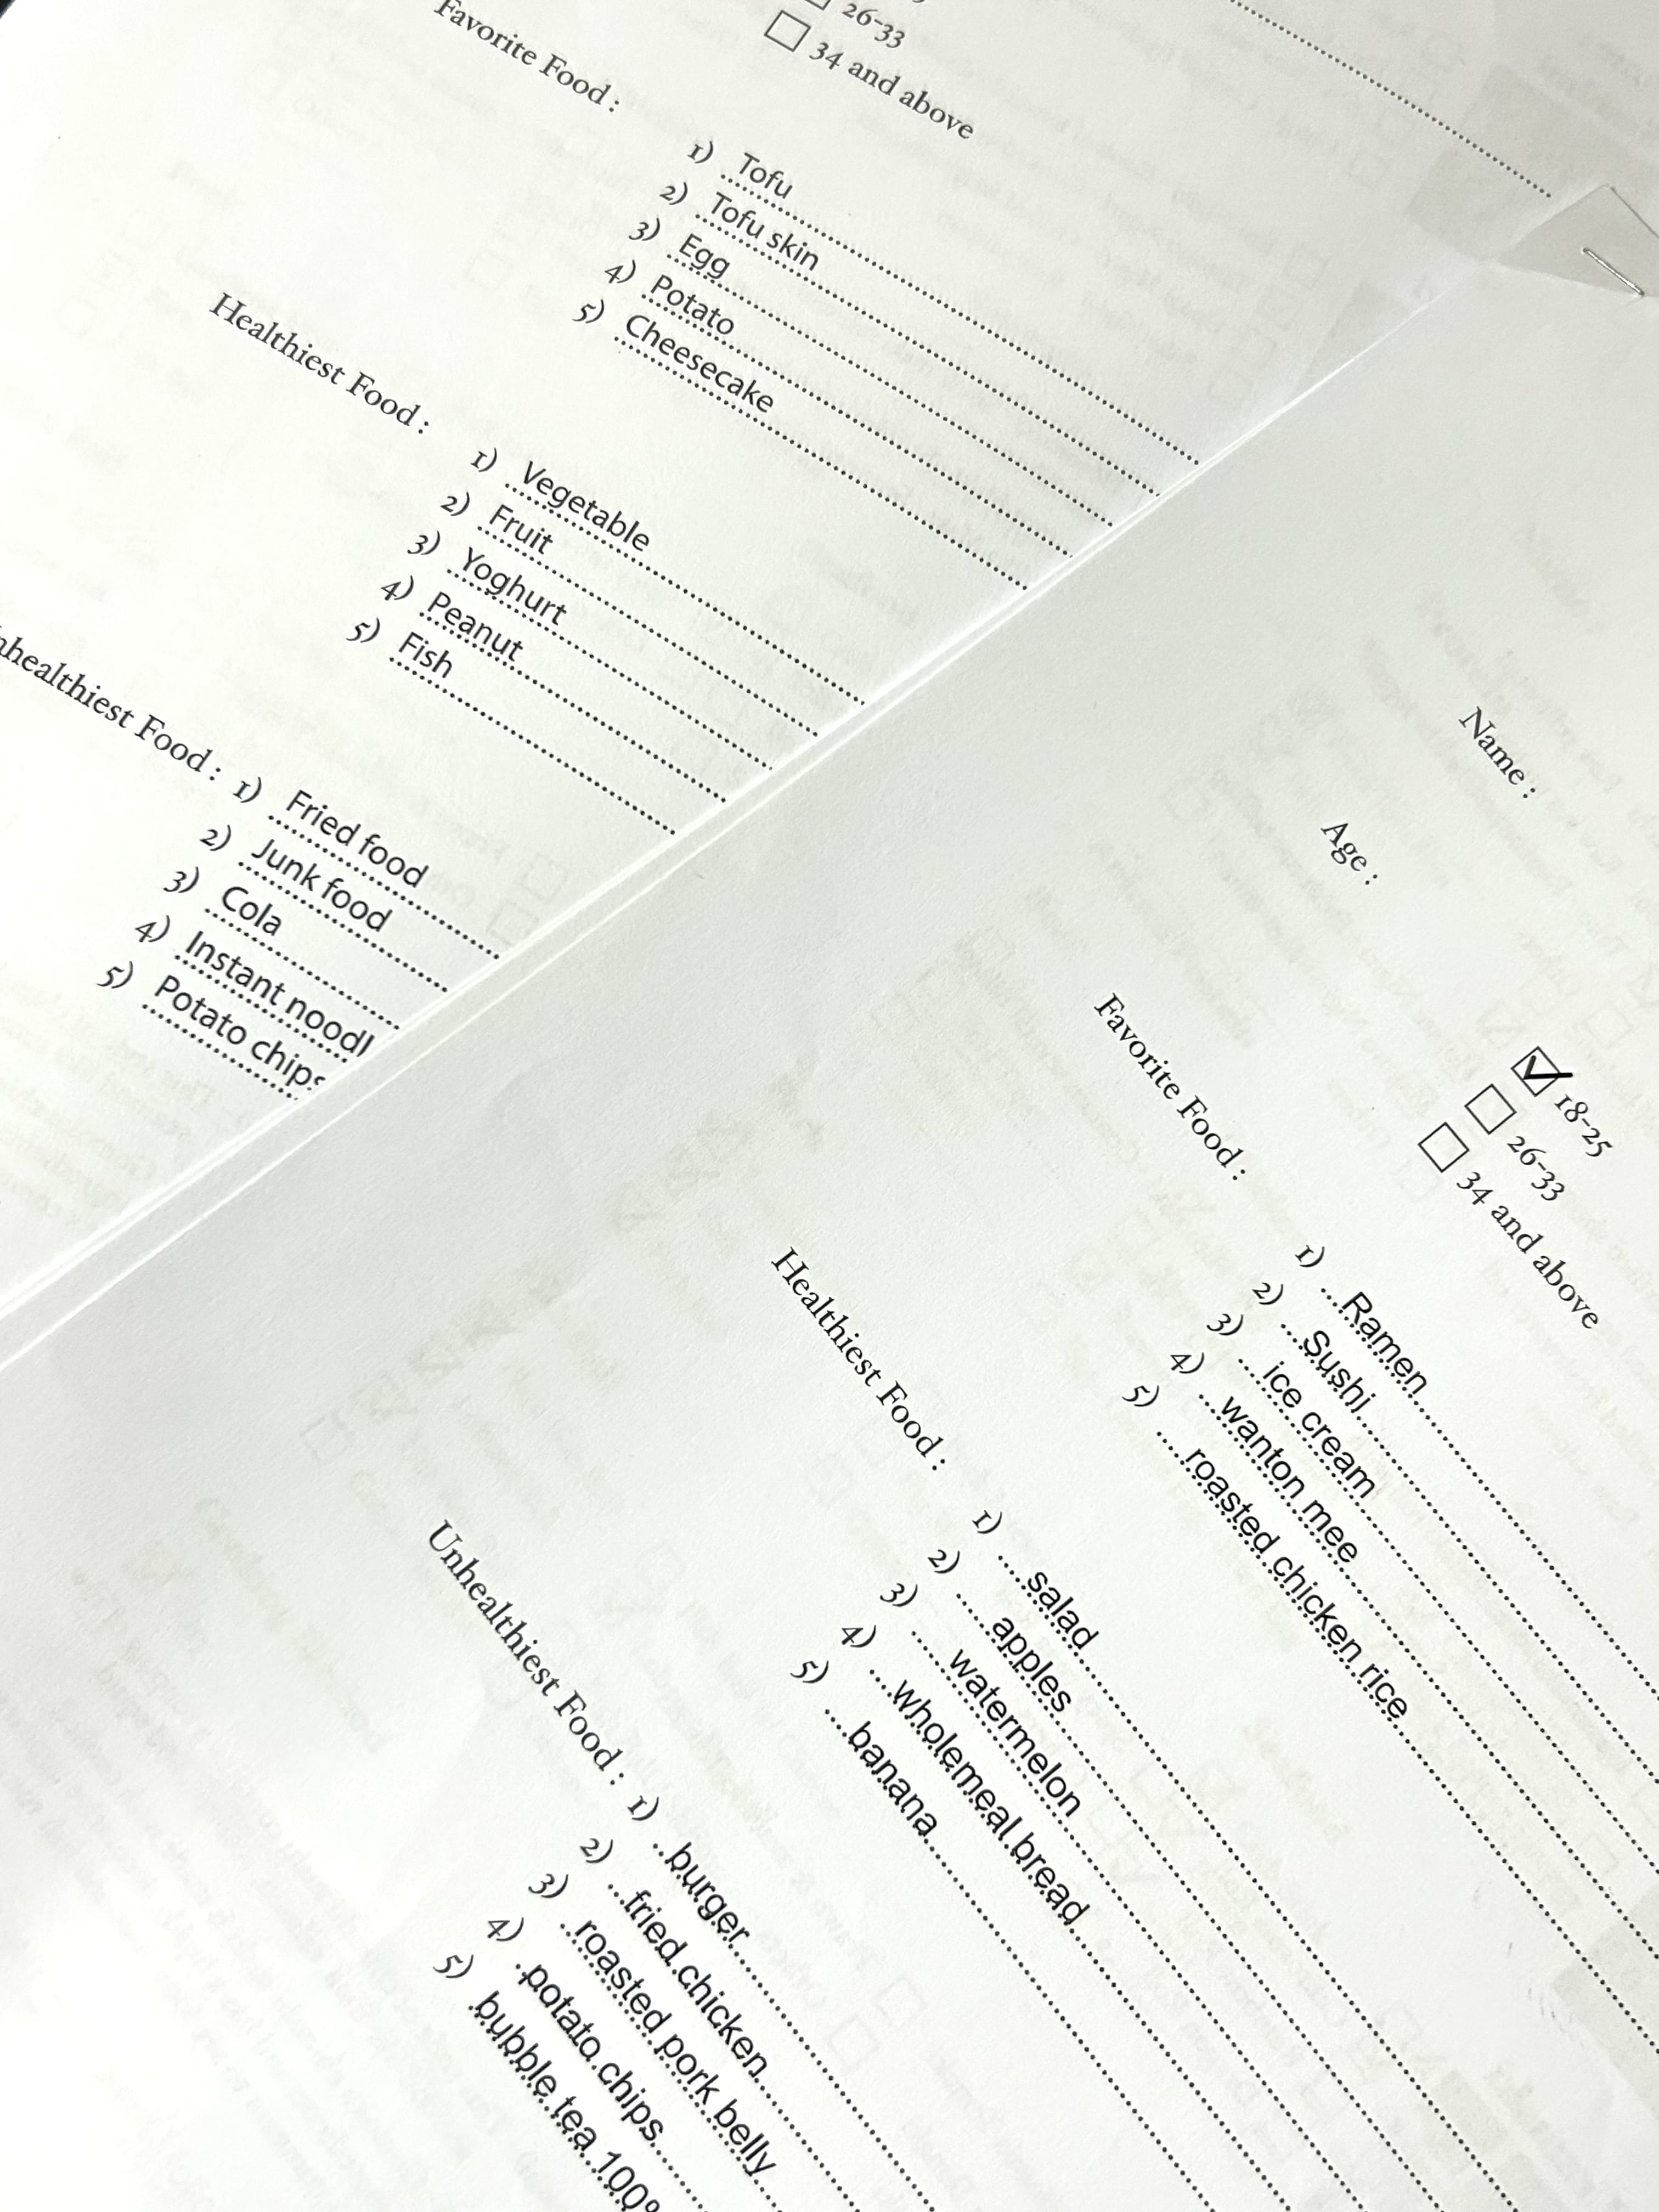
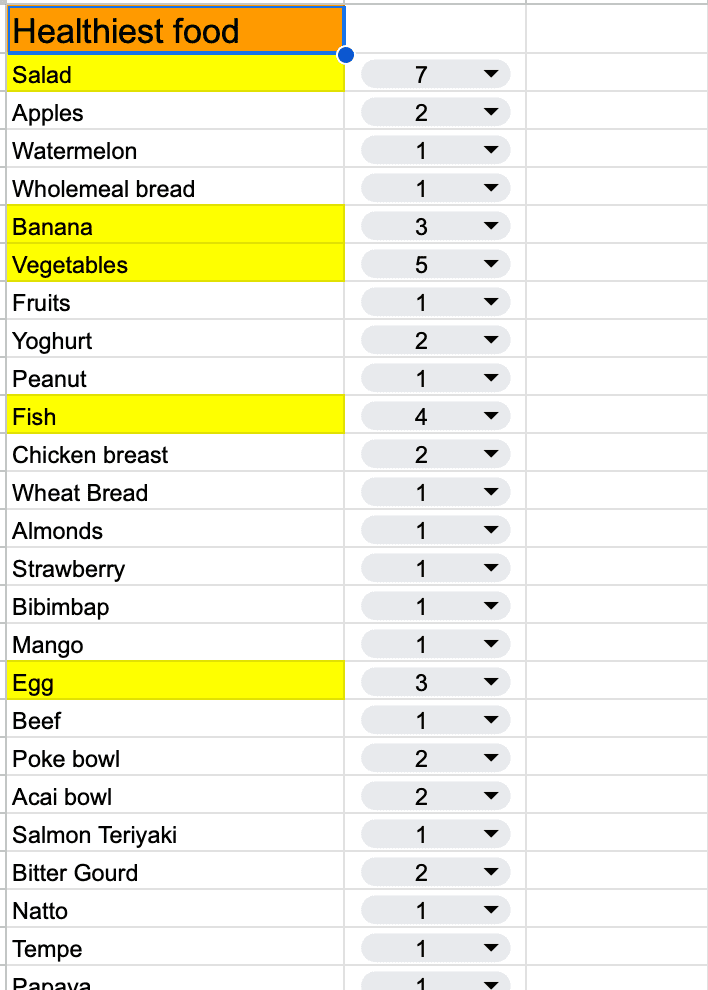
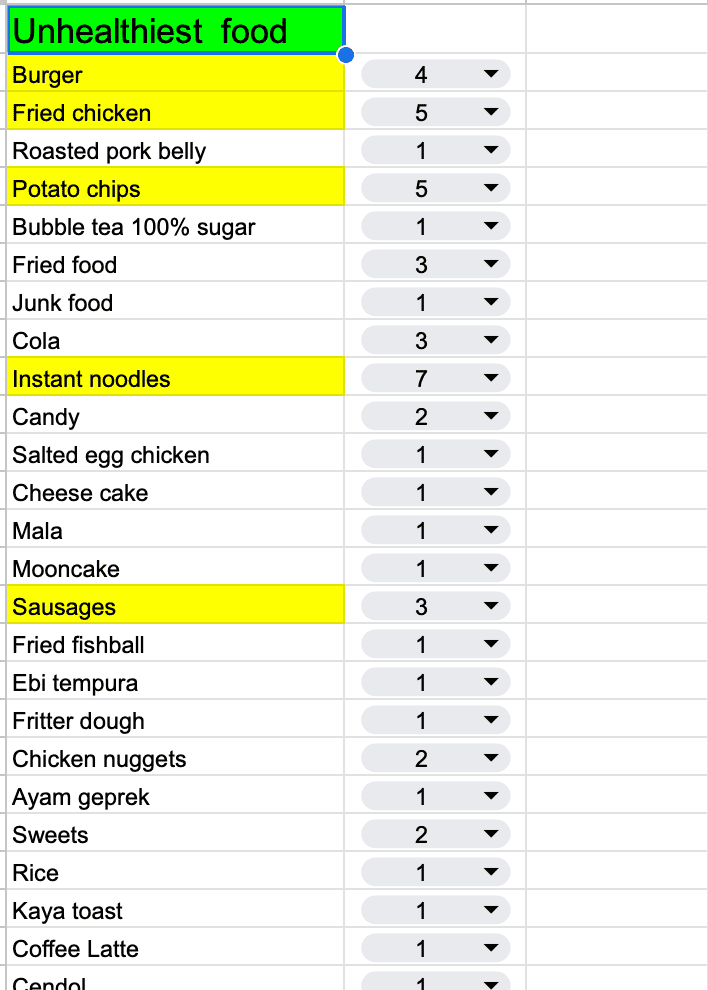
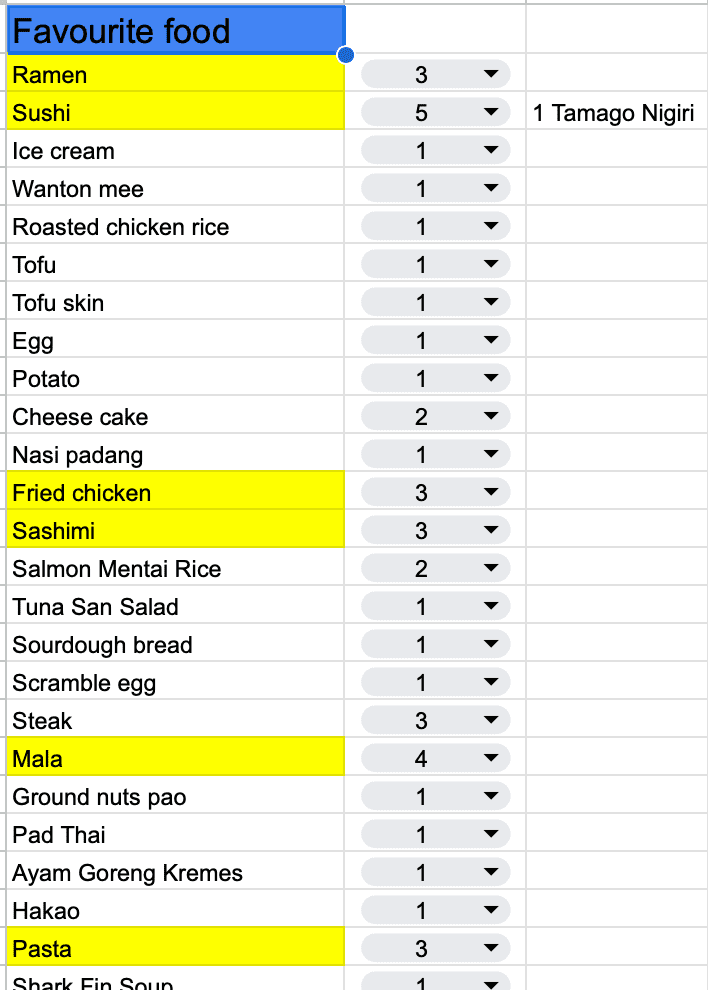
After the collection of food items data from our peers. We parsed through the collected information and curate the top 5 food items from the categories of 'Favourite', 'Healthiest', 'Unhealthiest'.
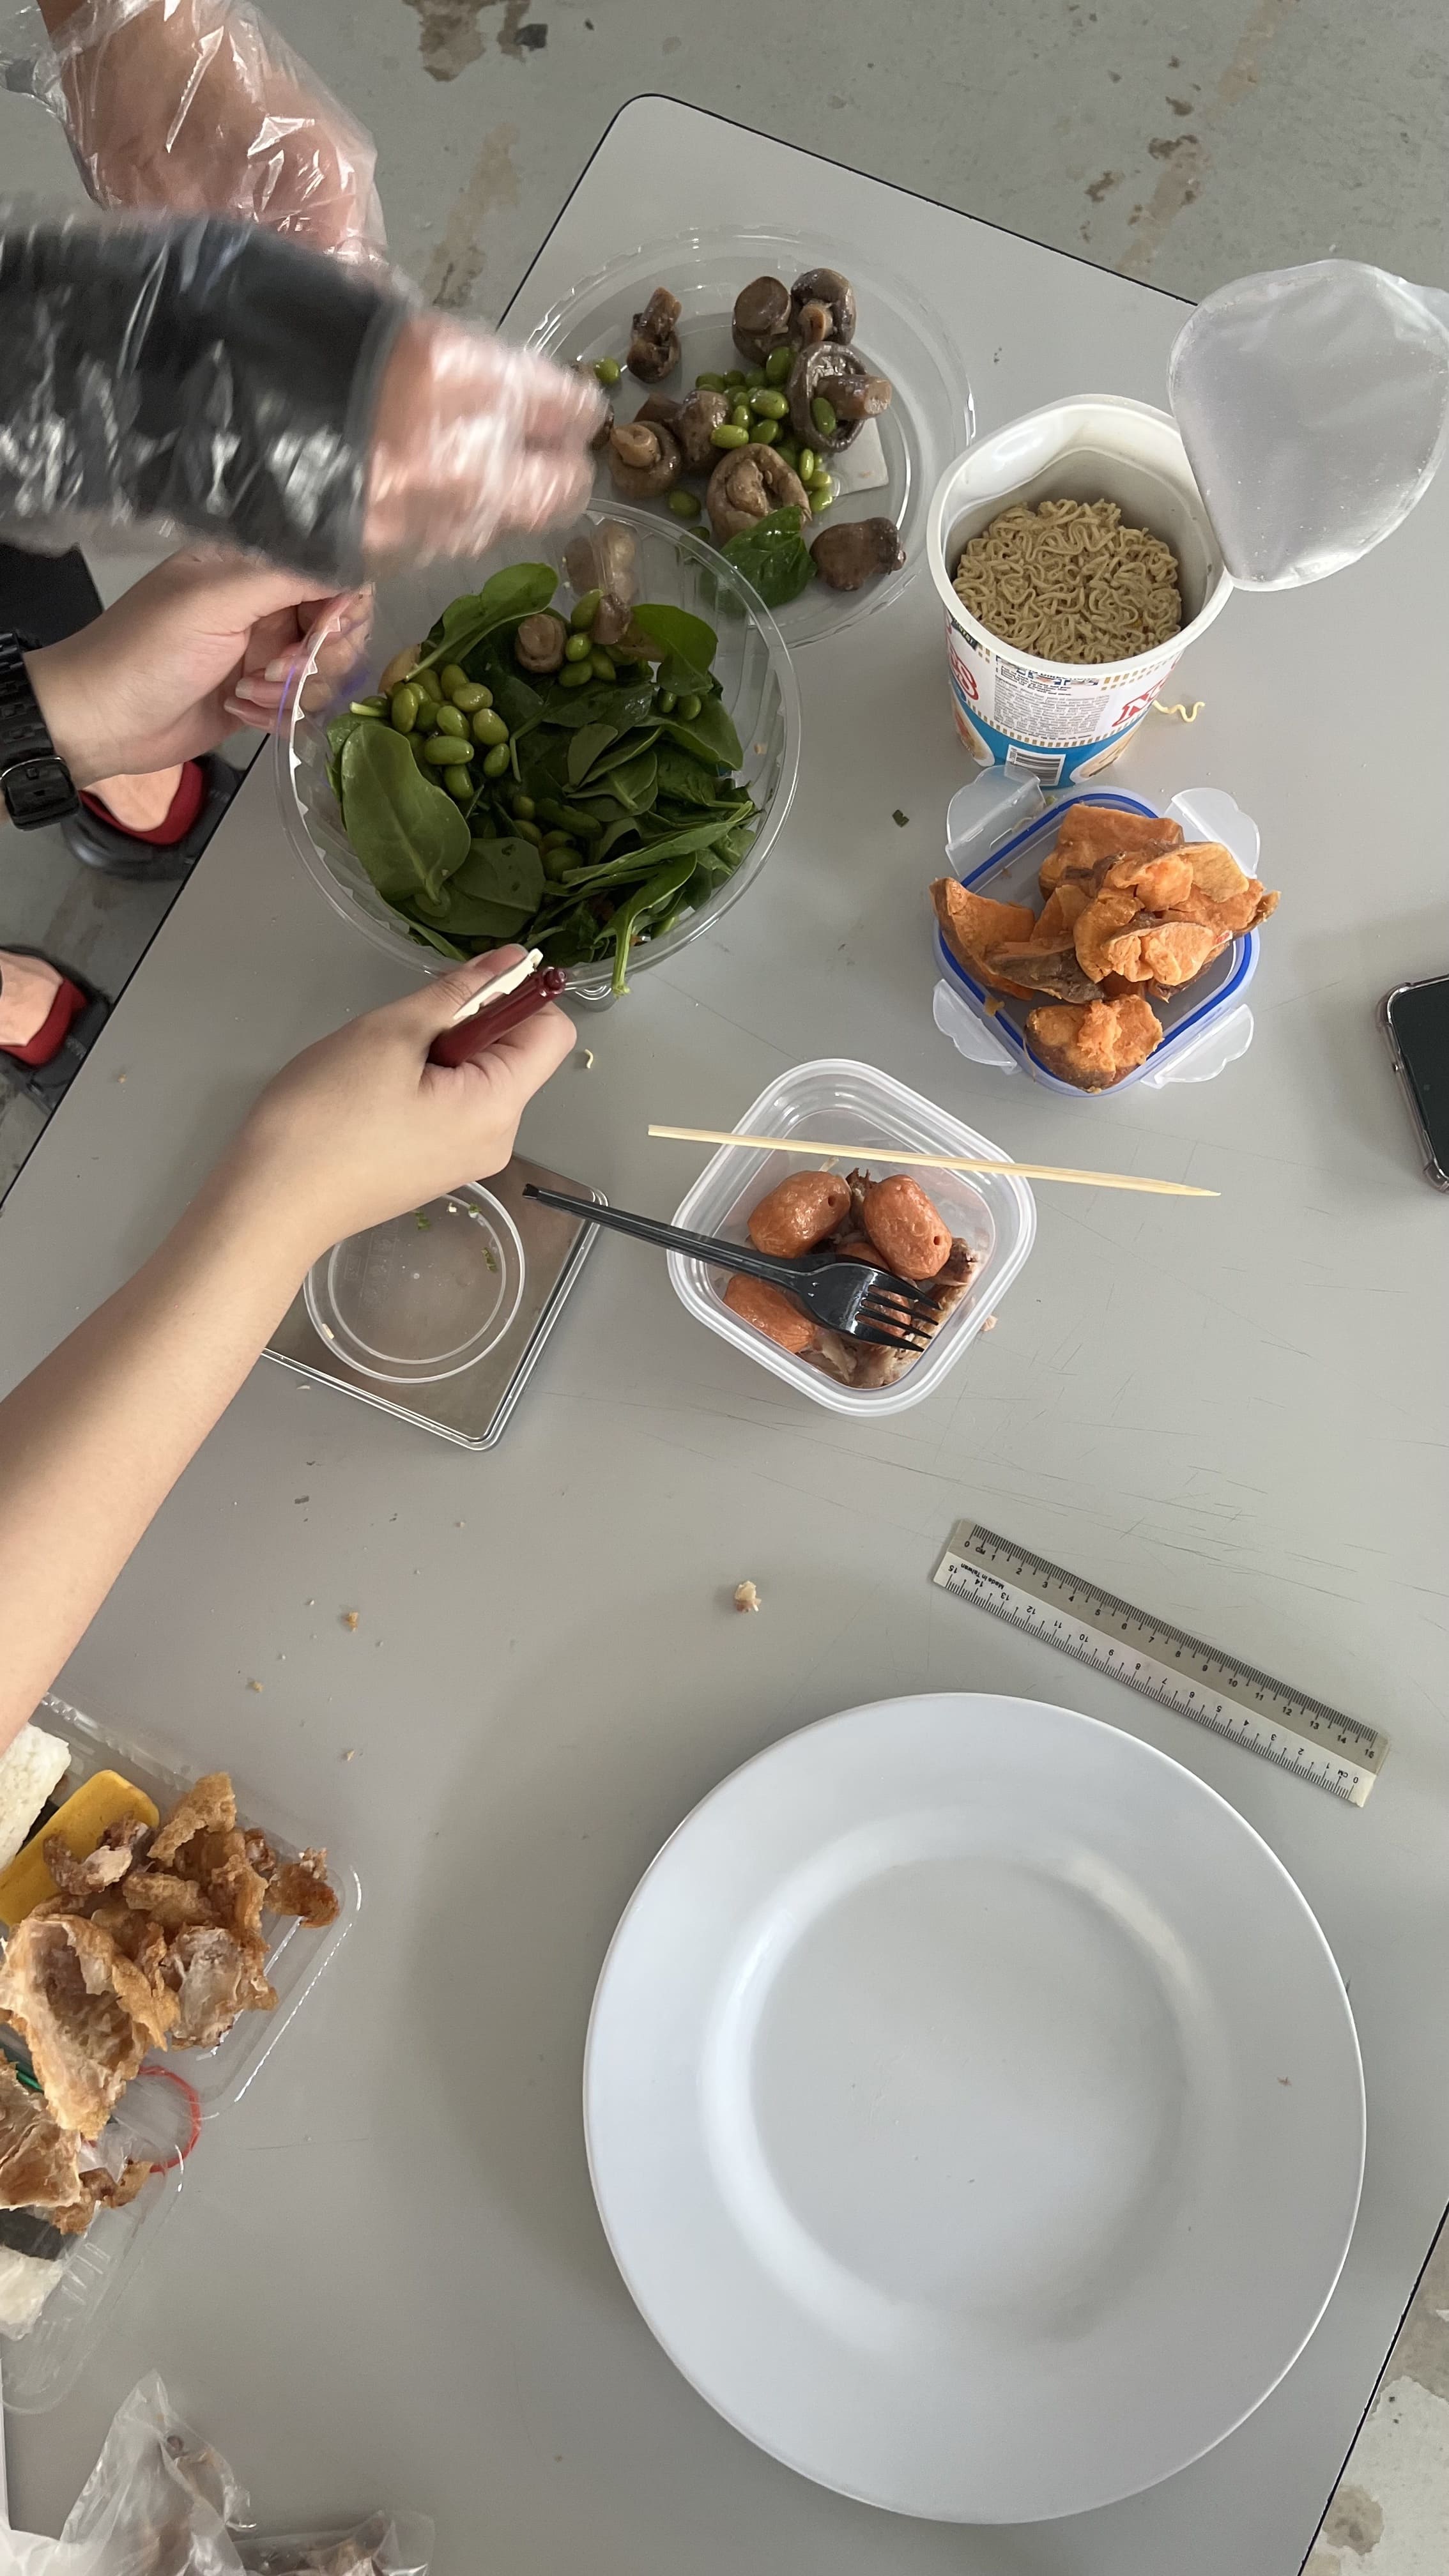
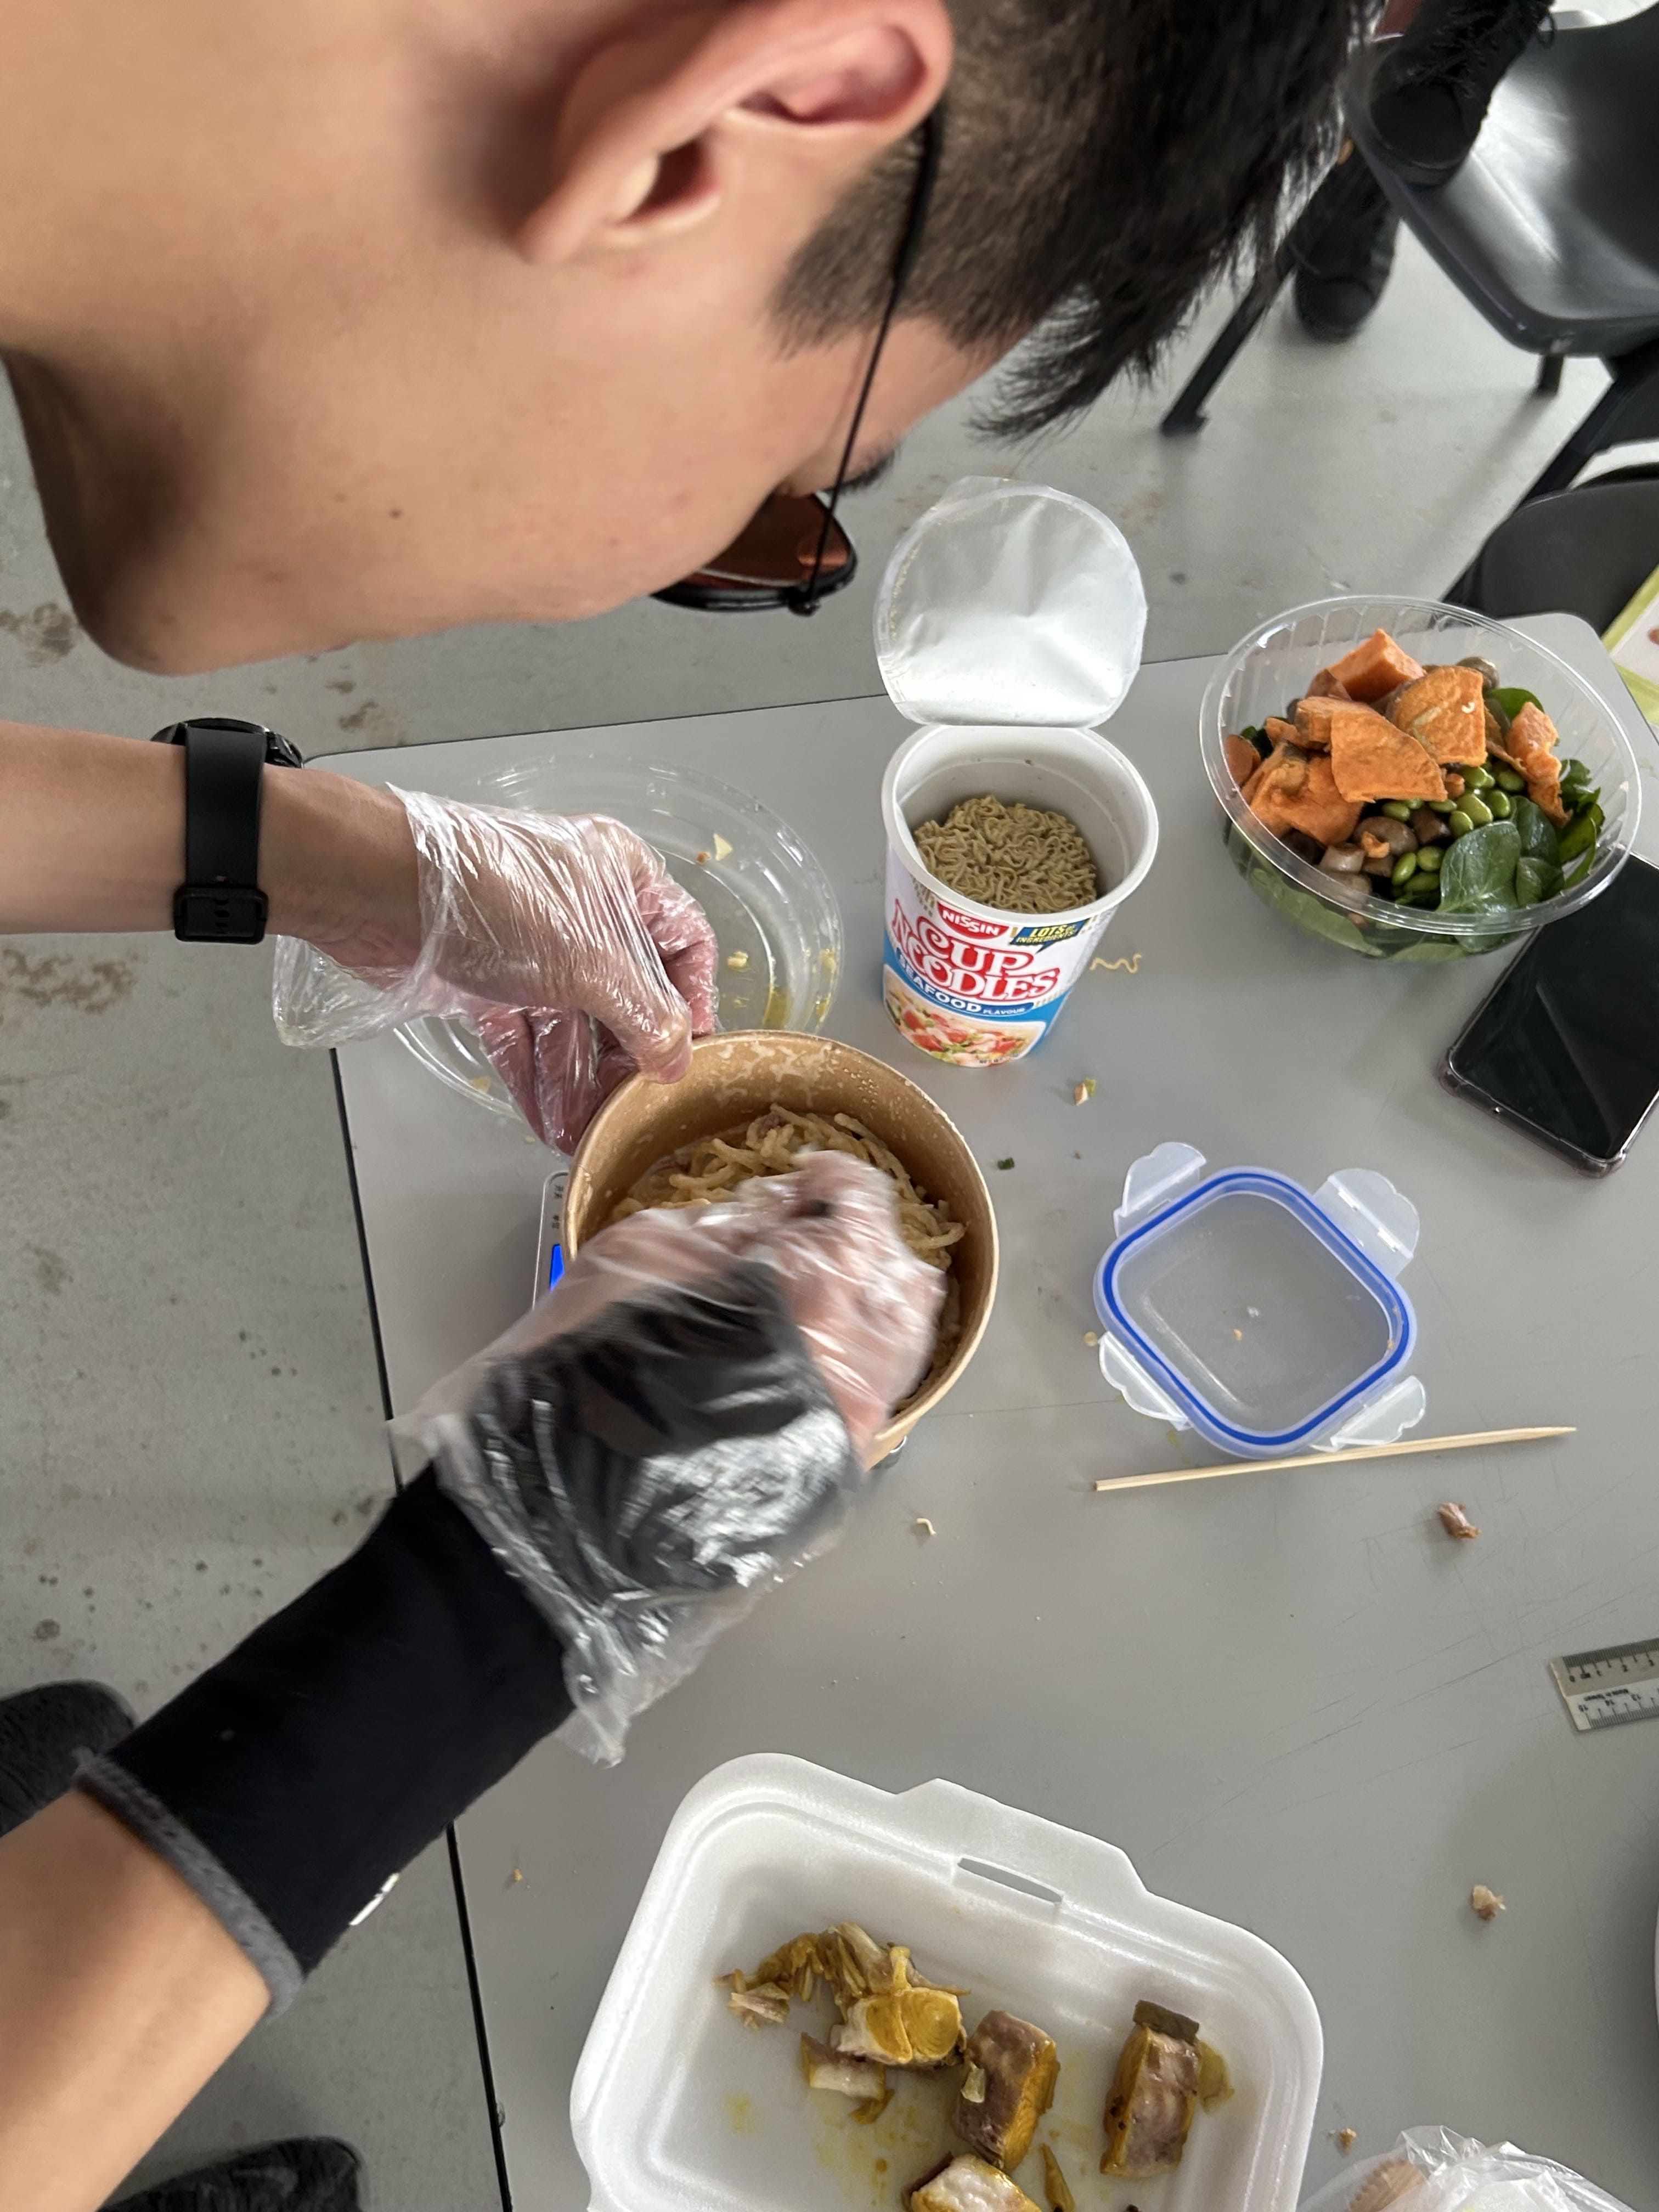
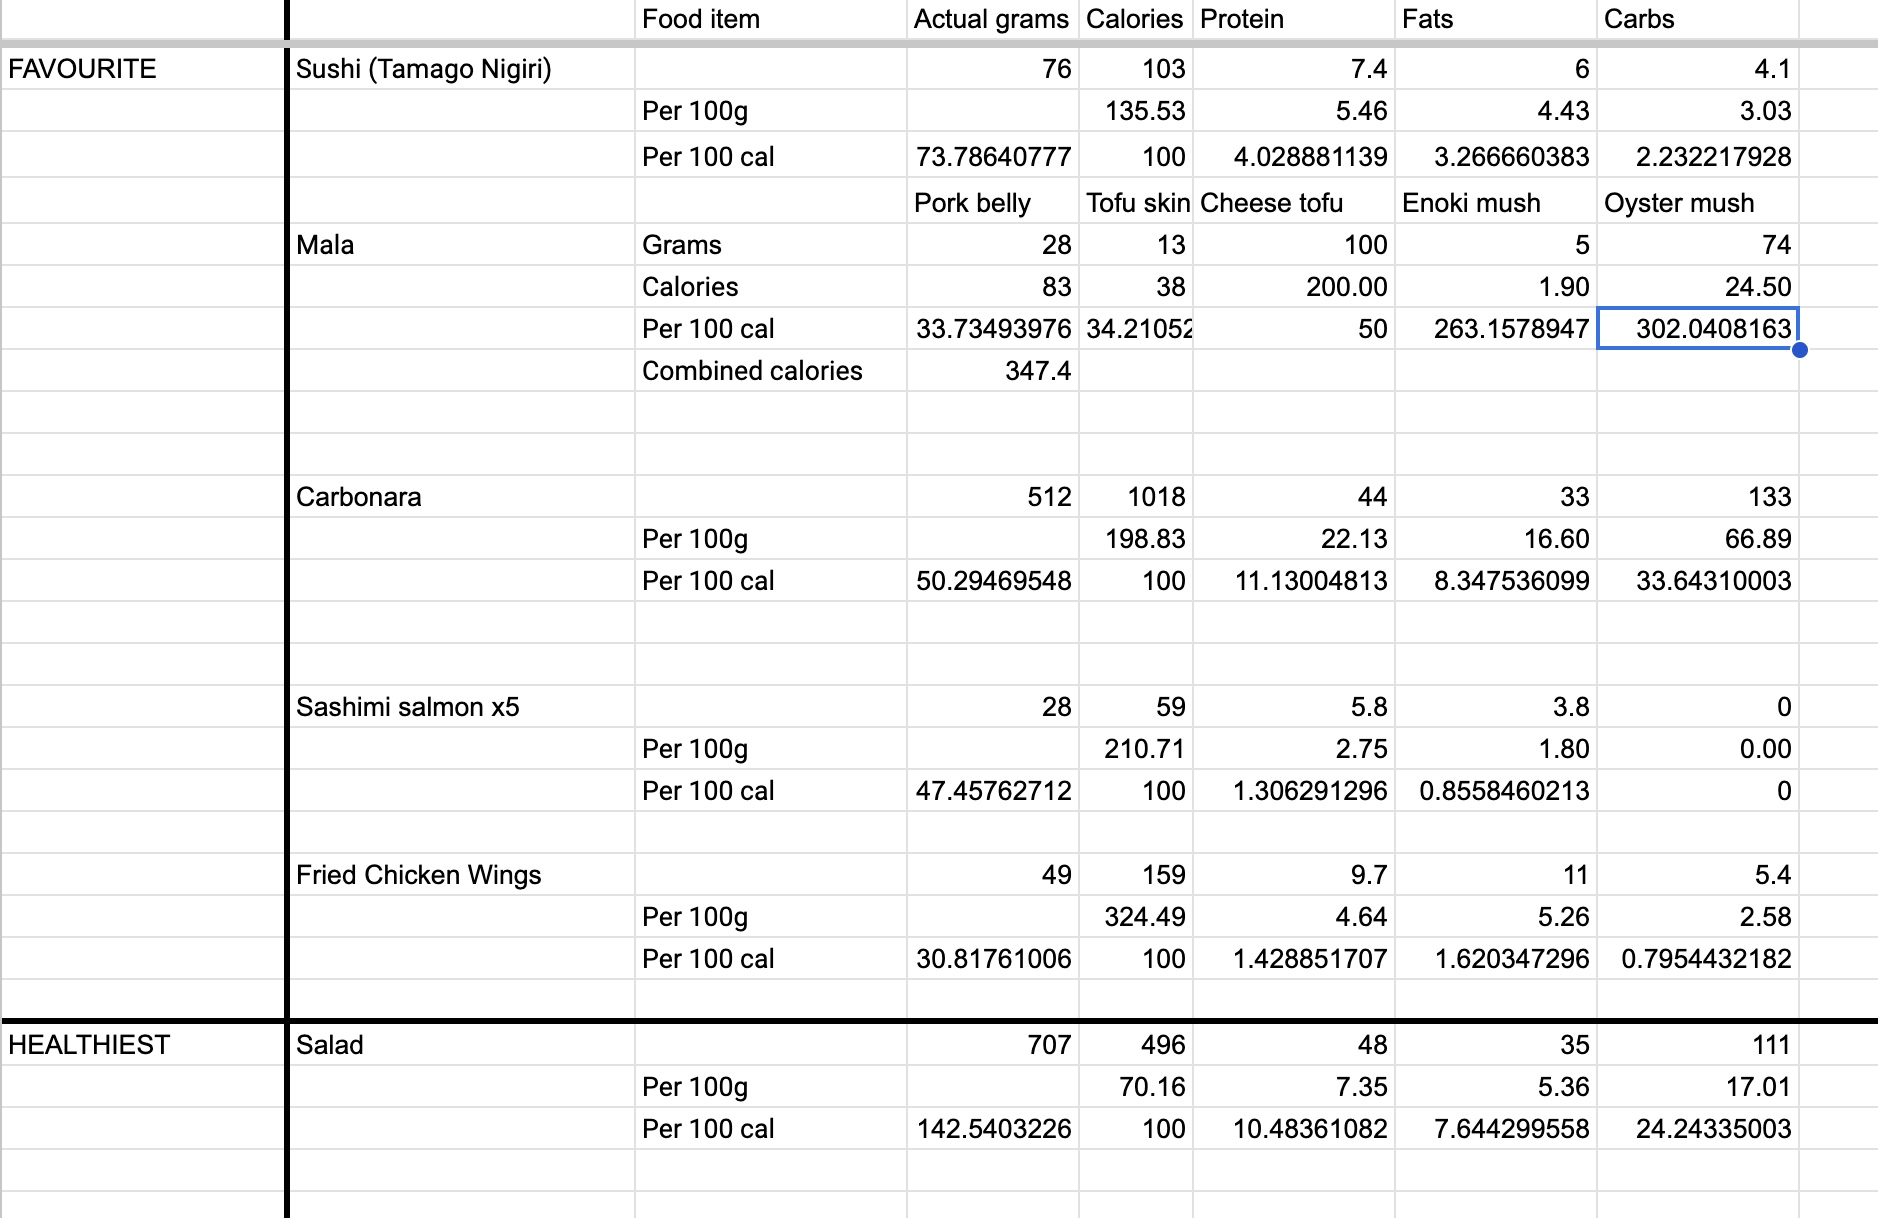
We decided the best way to tackle this project is to collect the weight information with the use of a small weighing scale of the different ingredients in each food categories. Afterwards we will use the caloric numbers from 'Nutritionix' a nutrition database, to collect the information of how much protein, carbs, and fats each food item has, parse it through math formulas, and get the correct numbers for the size of the portions, and nutrition values.
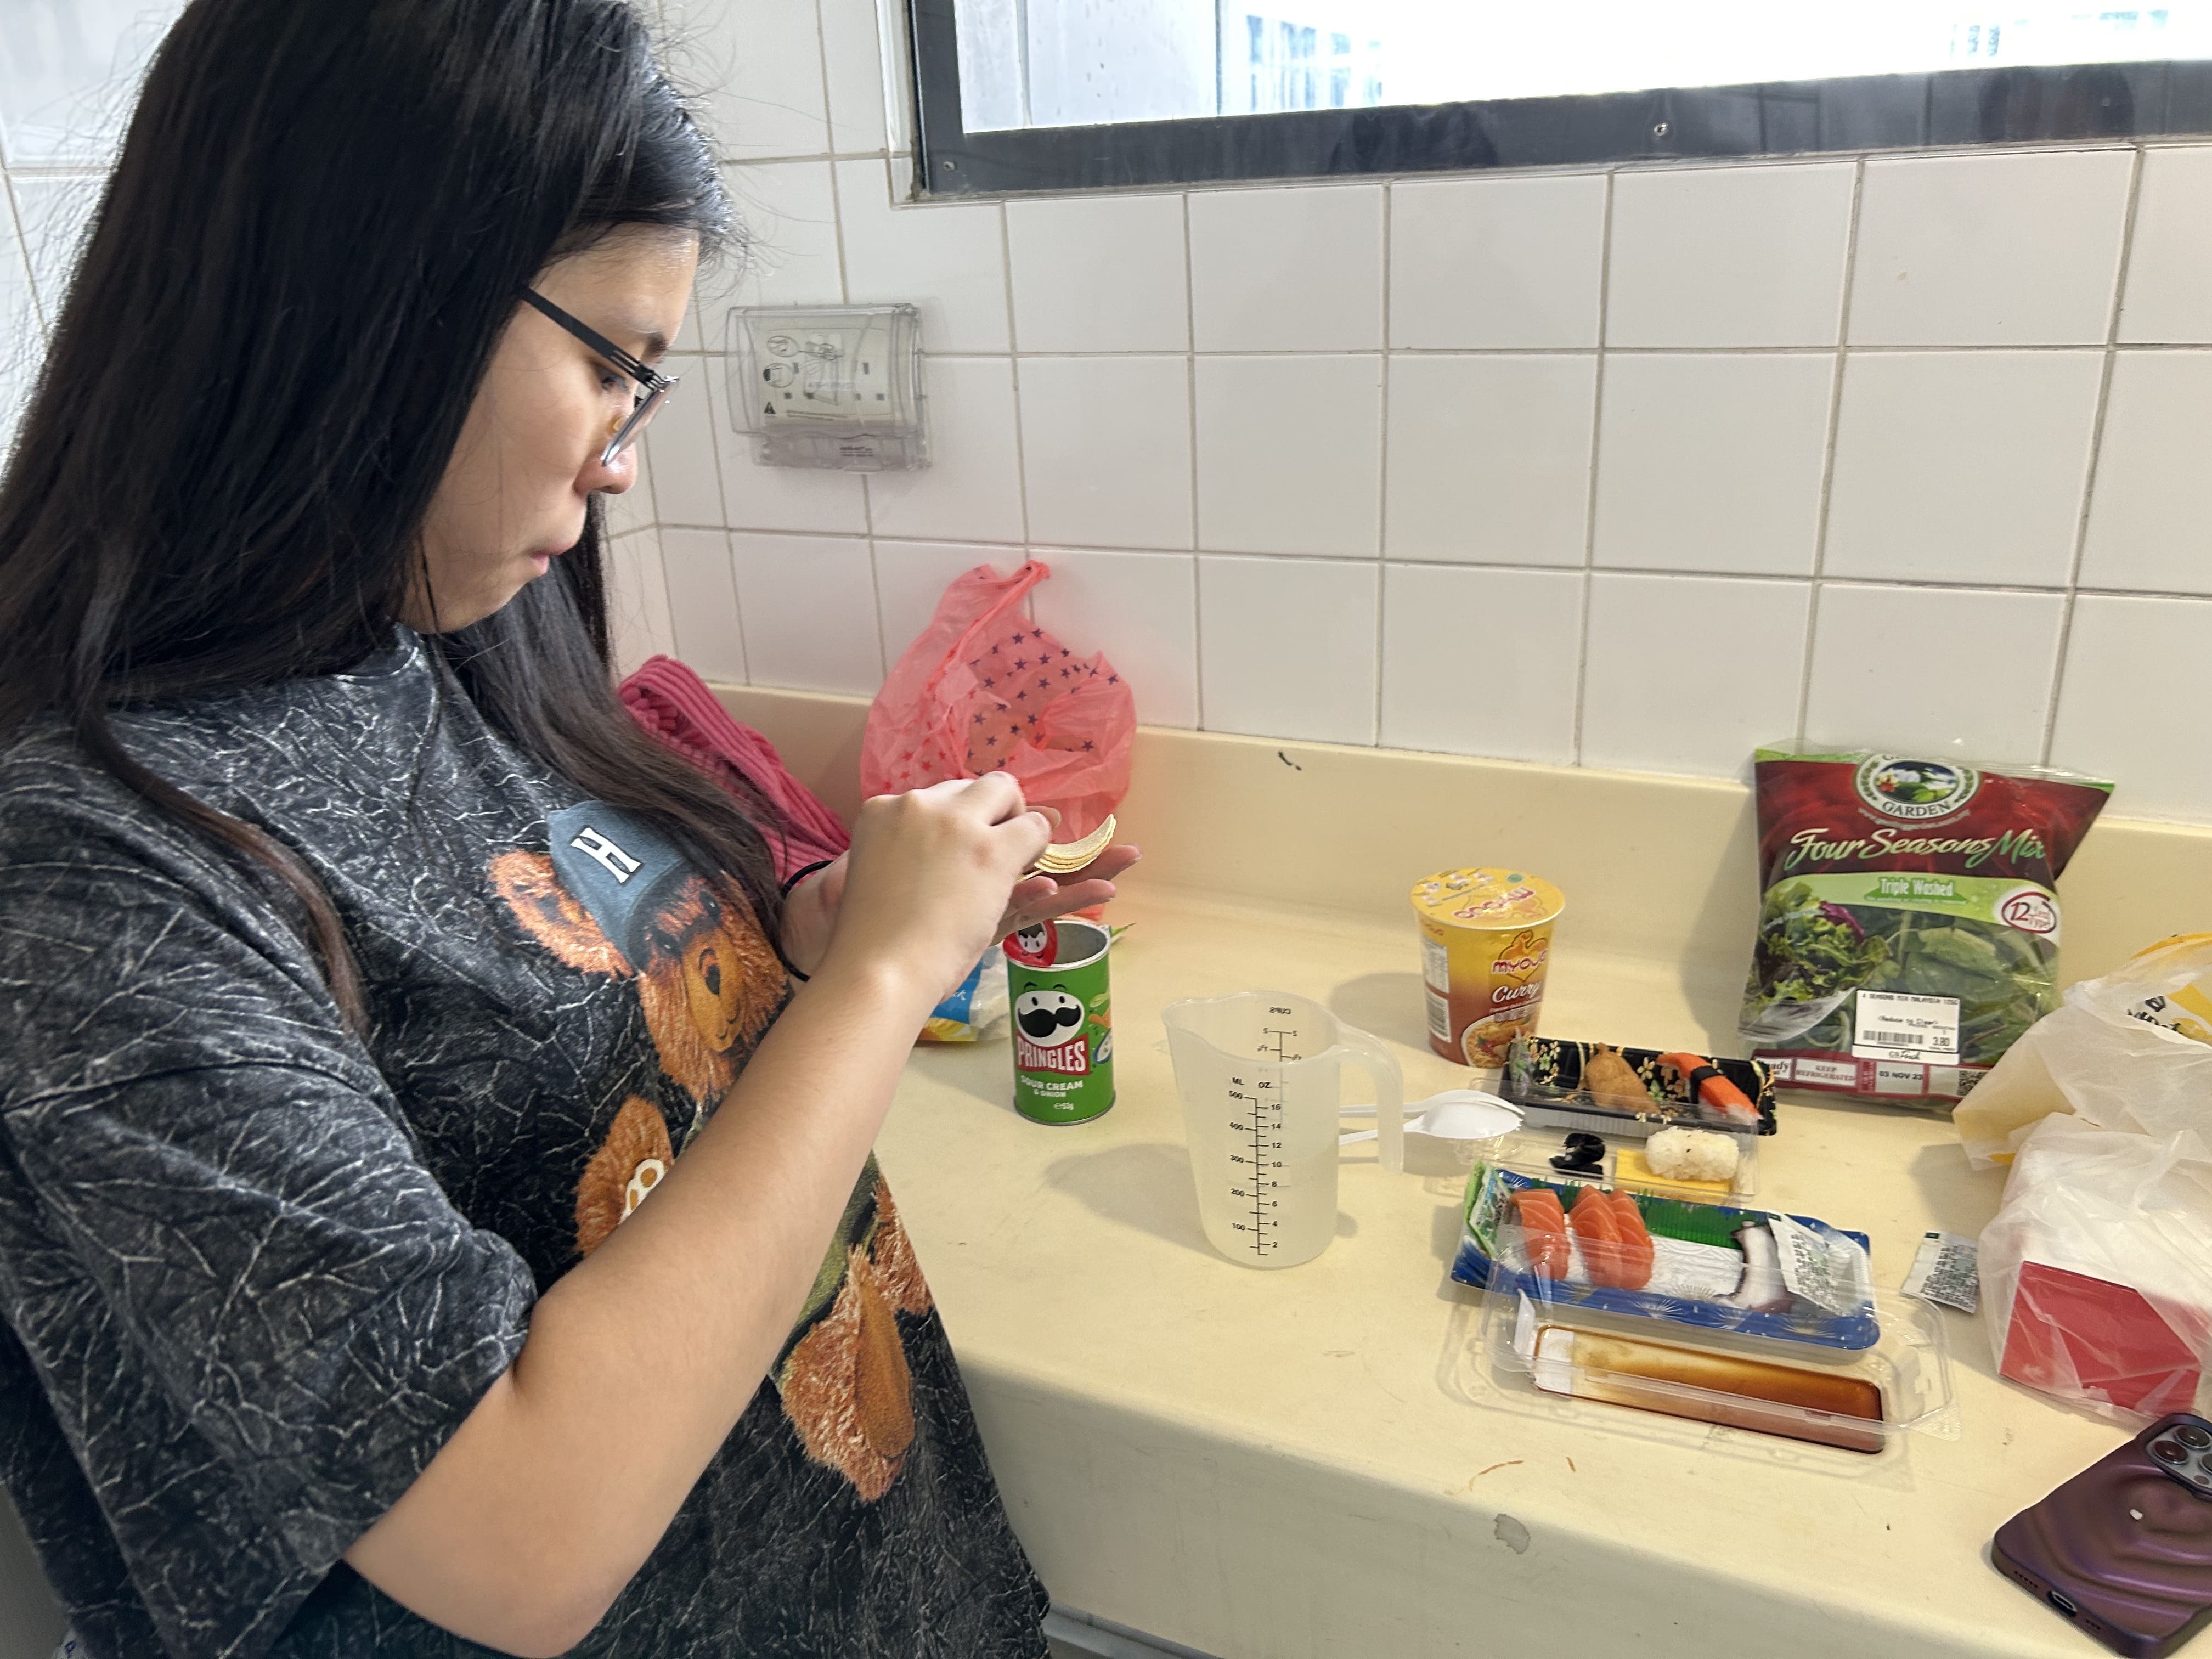
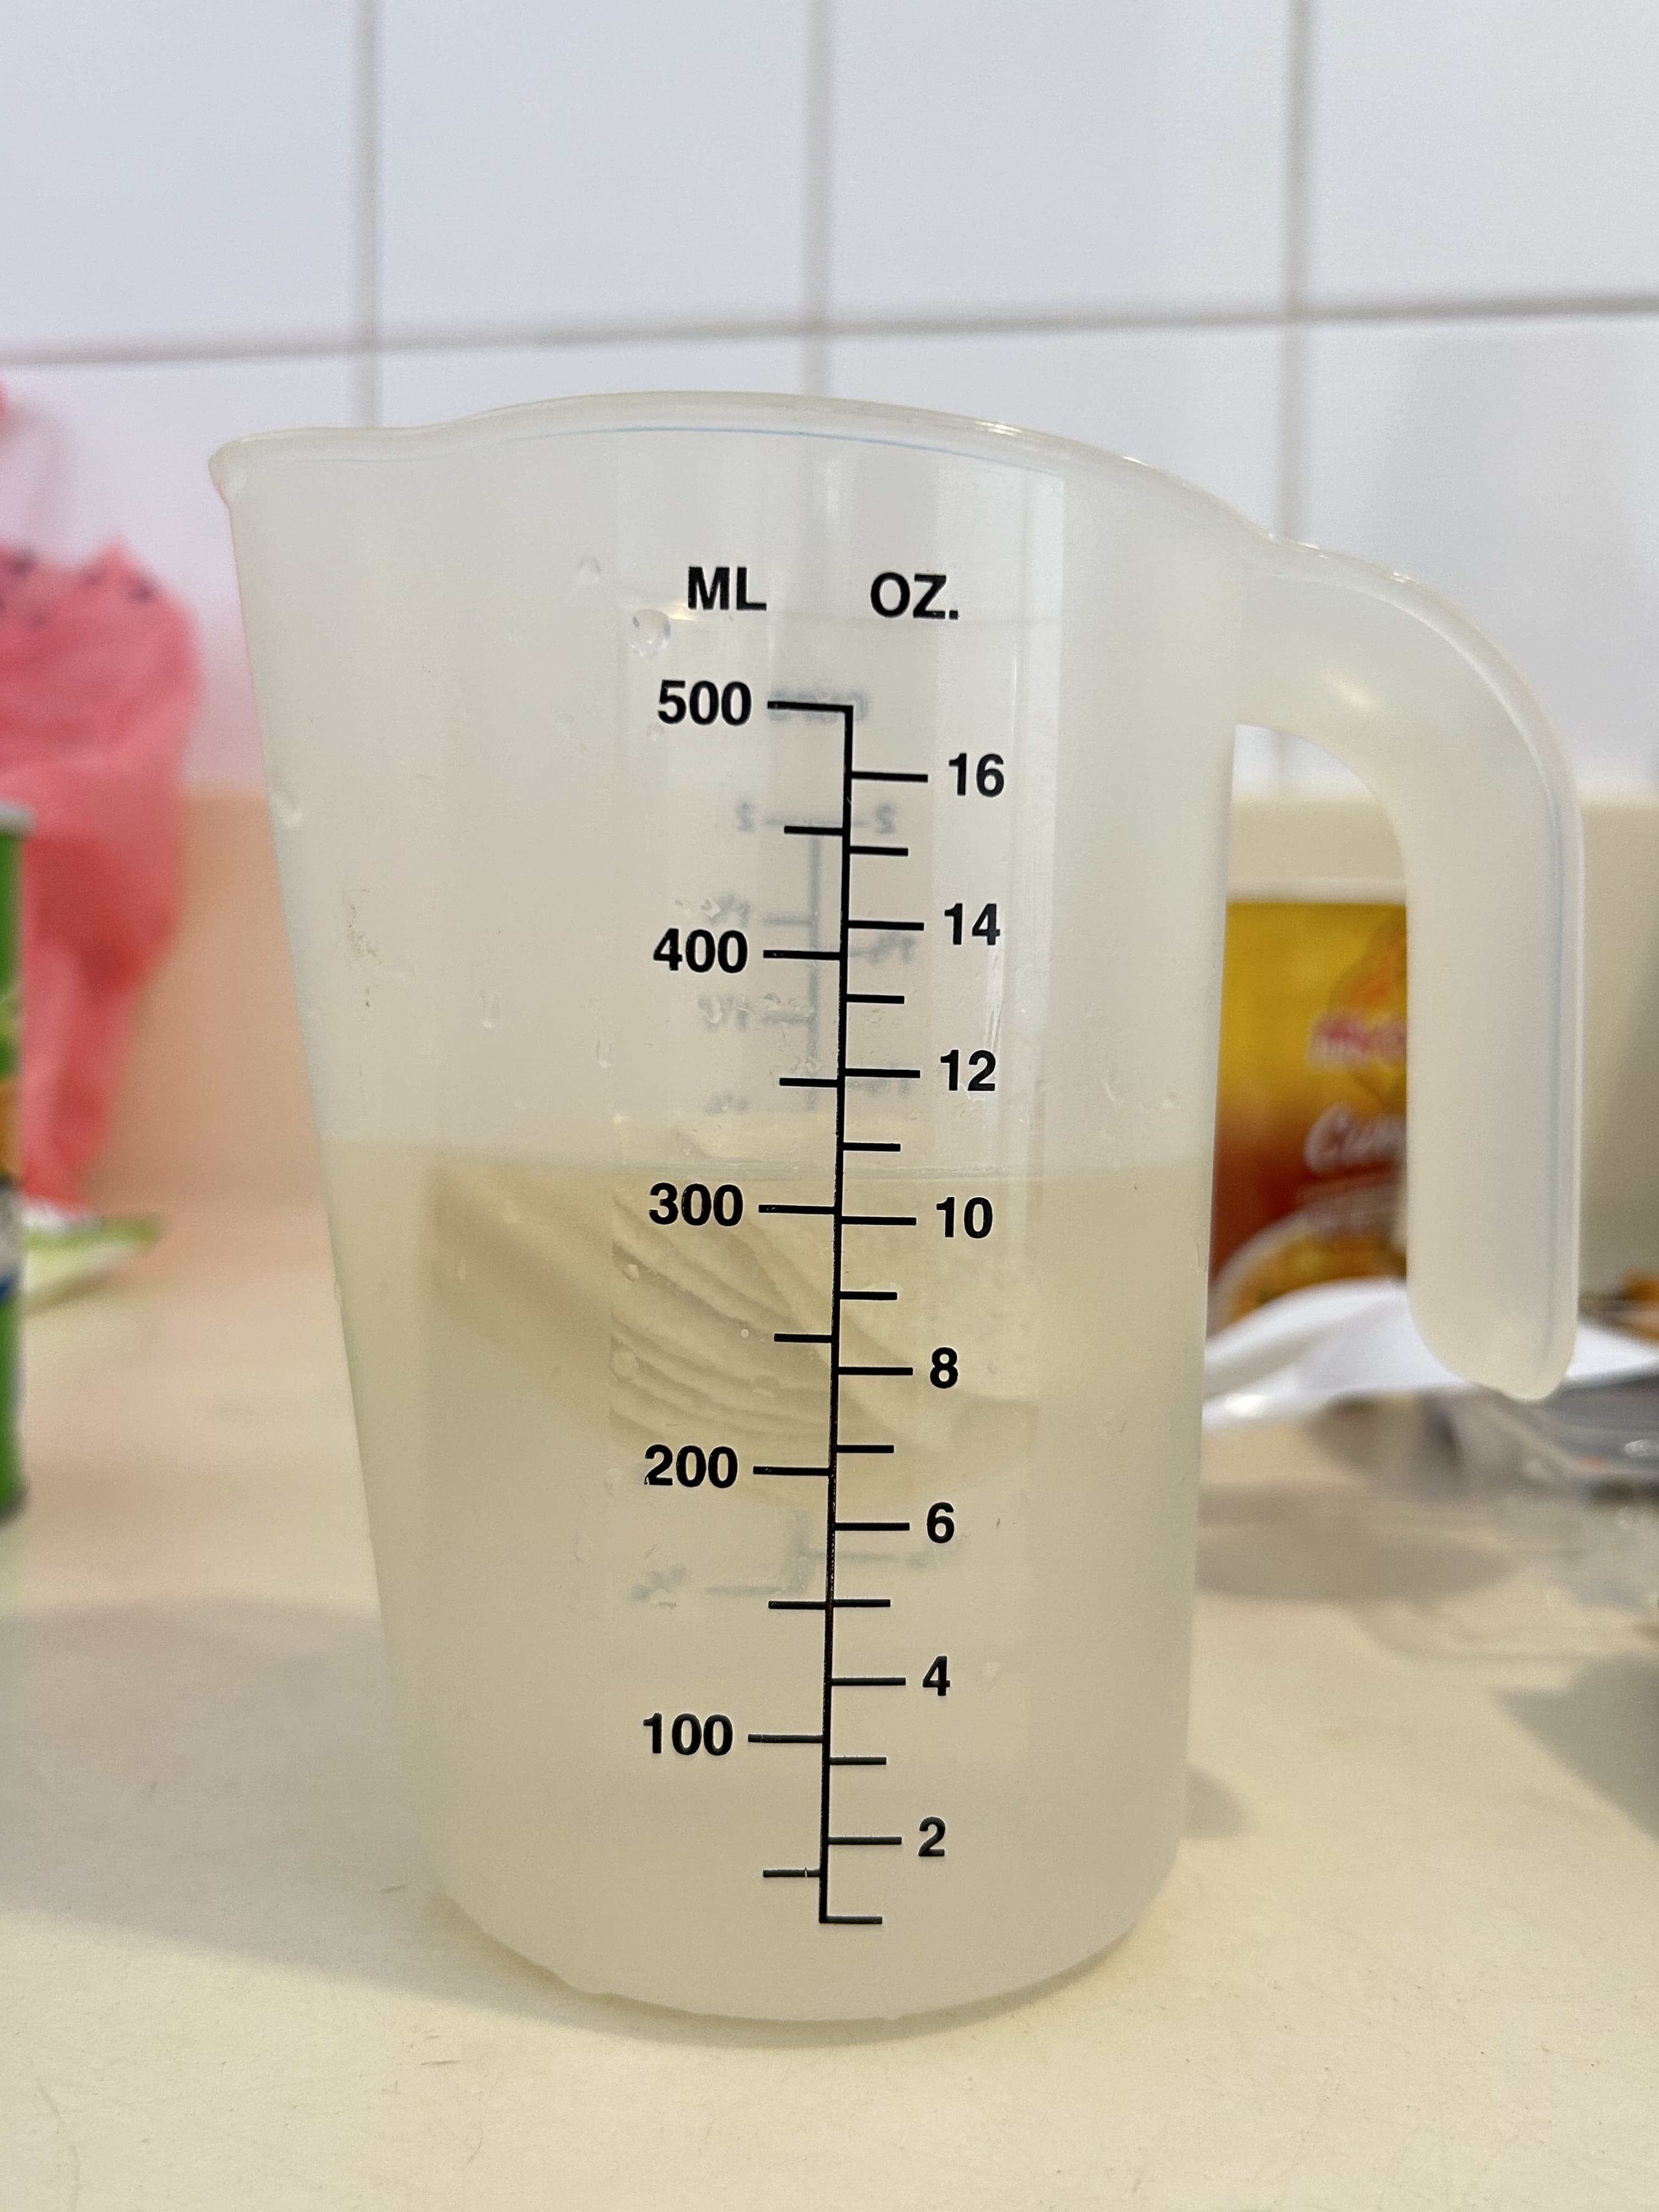
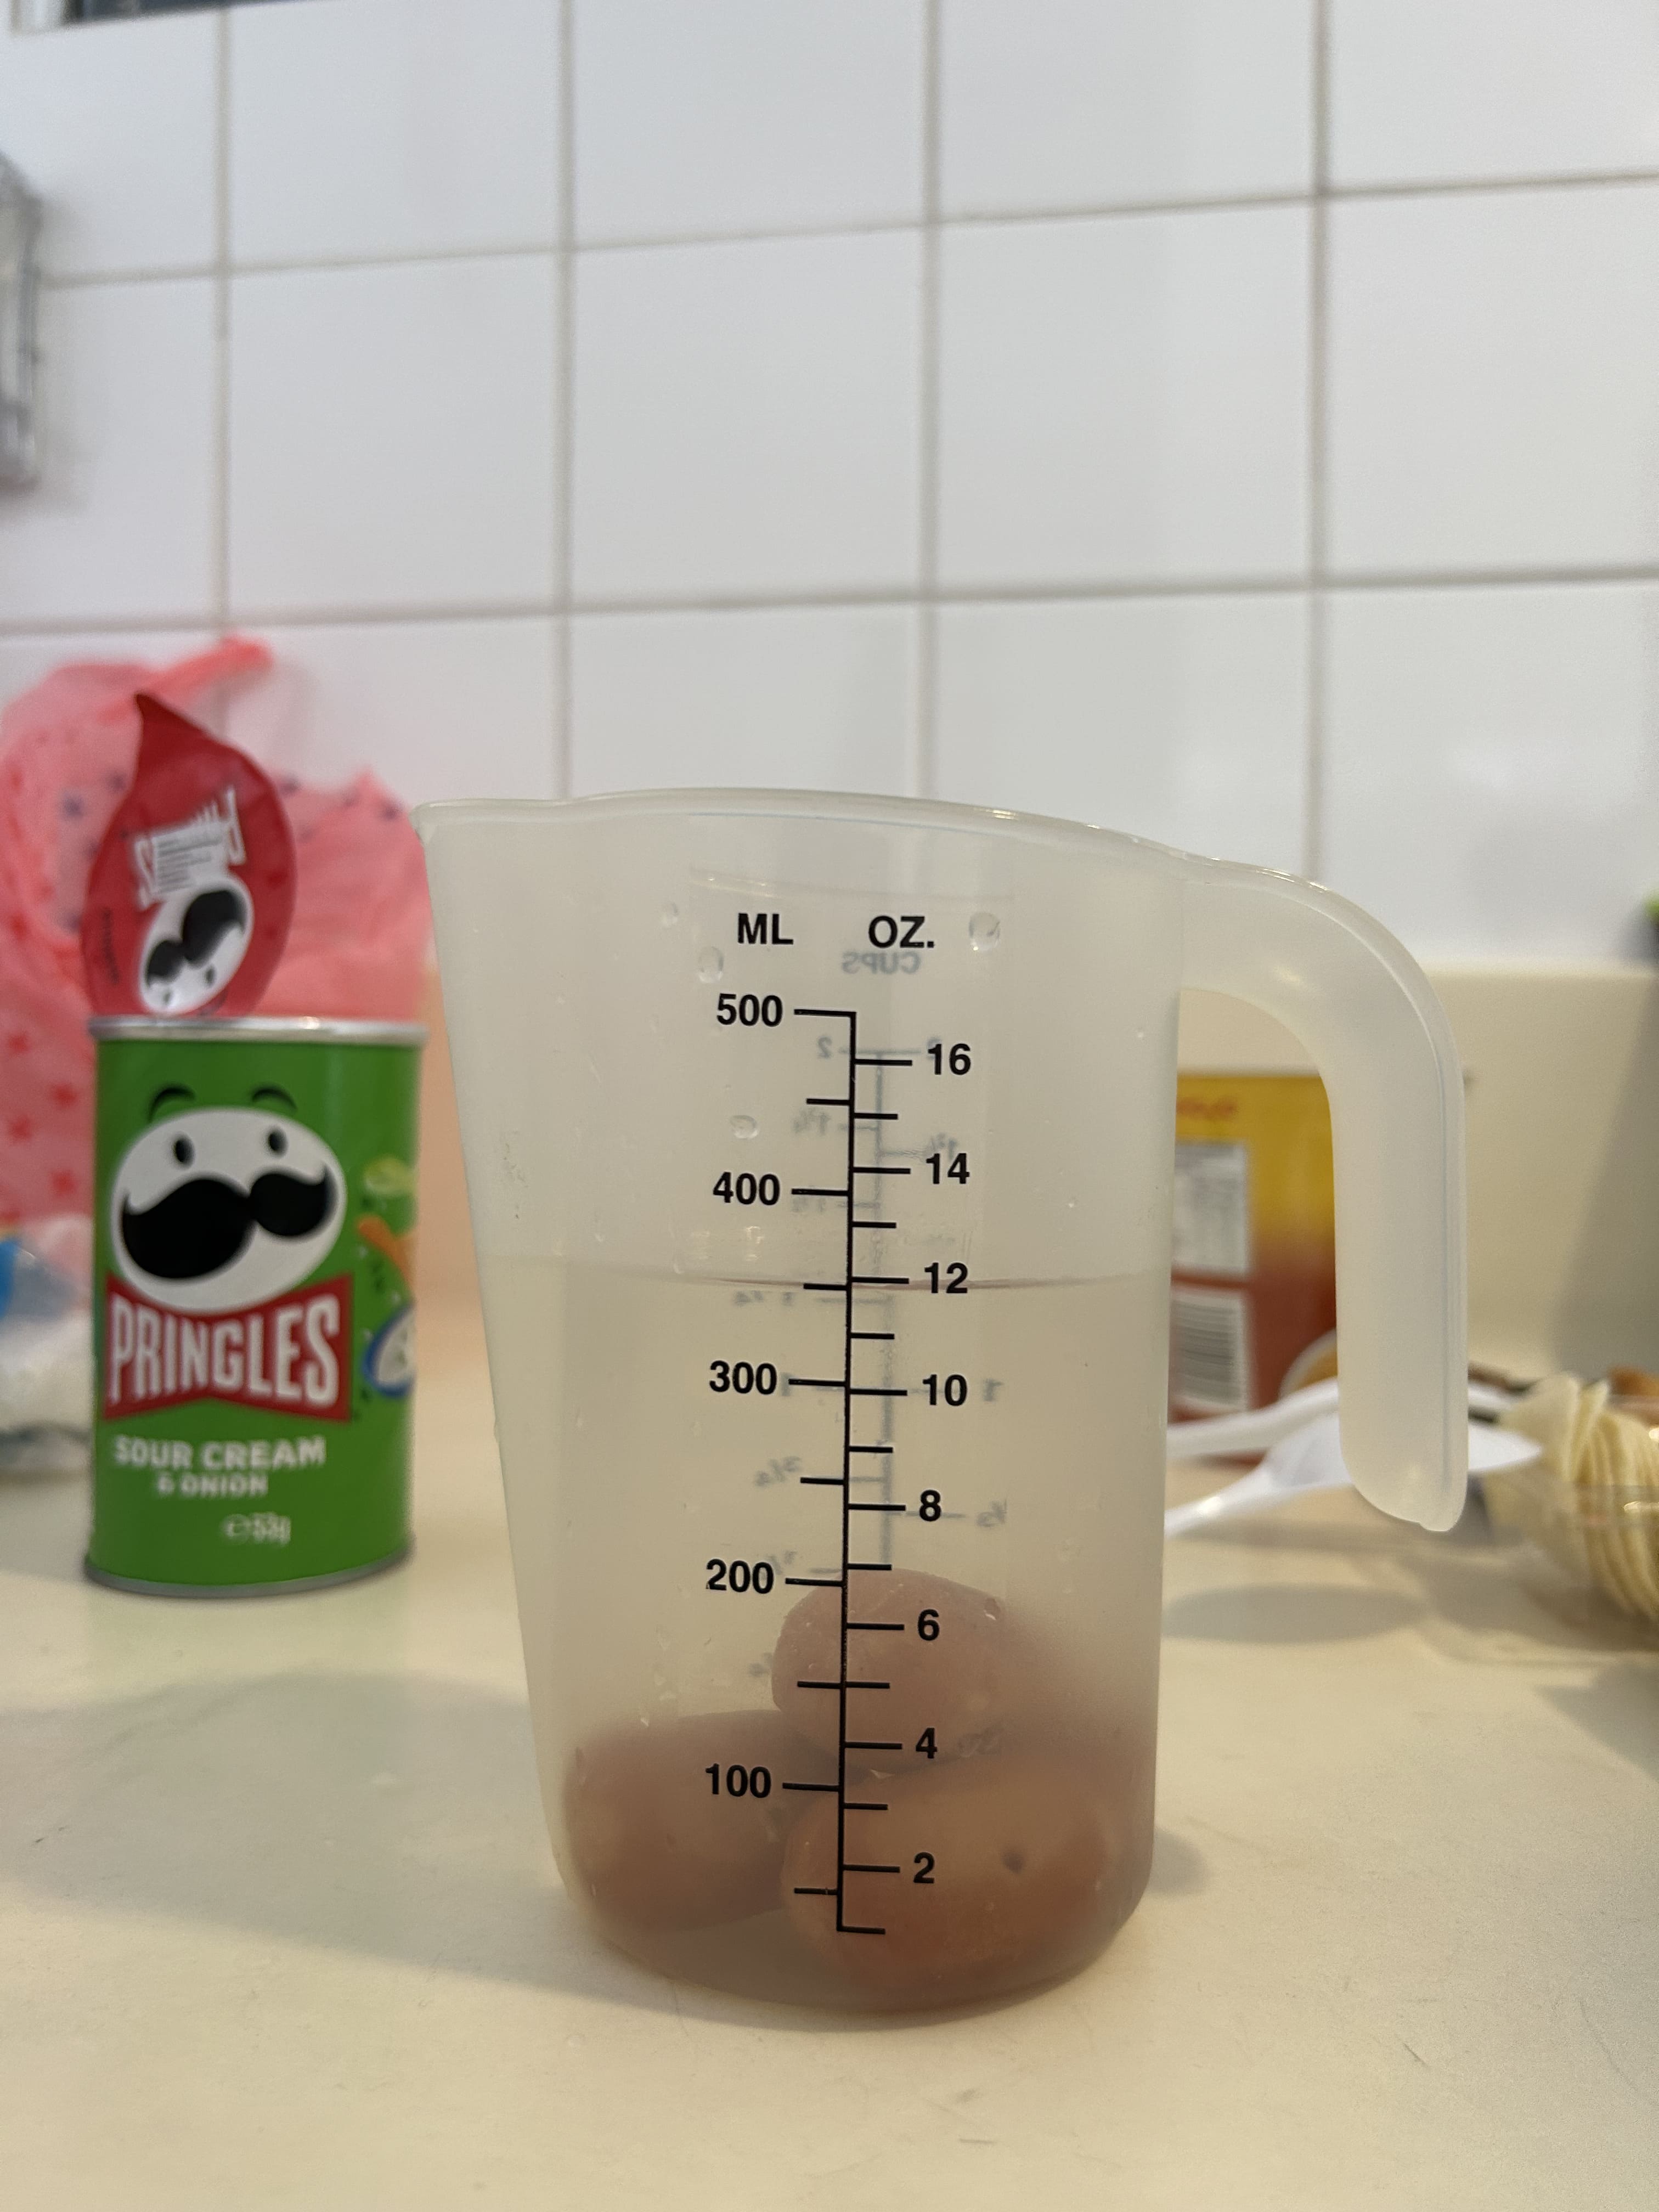
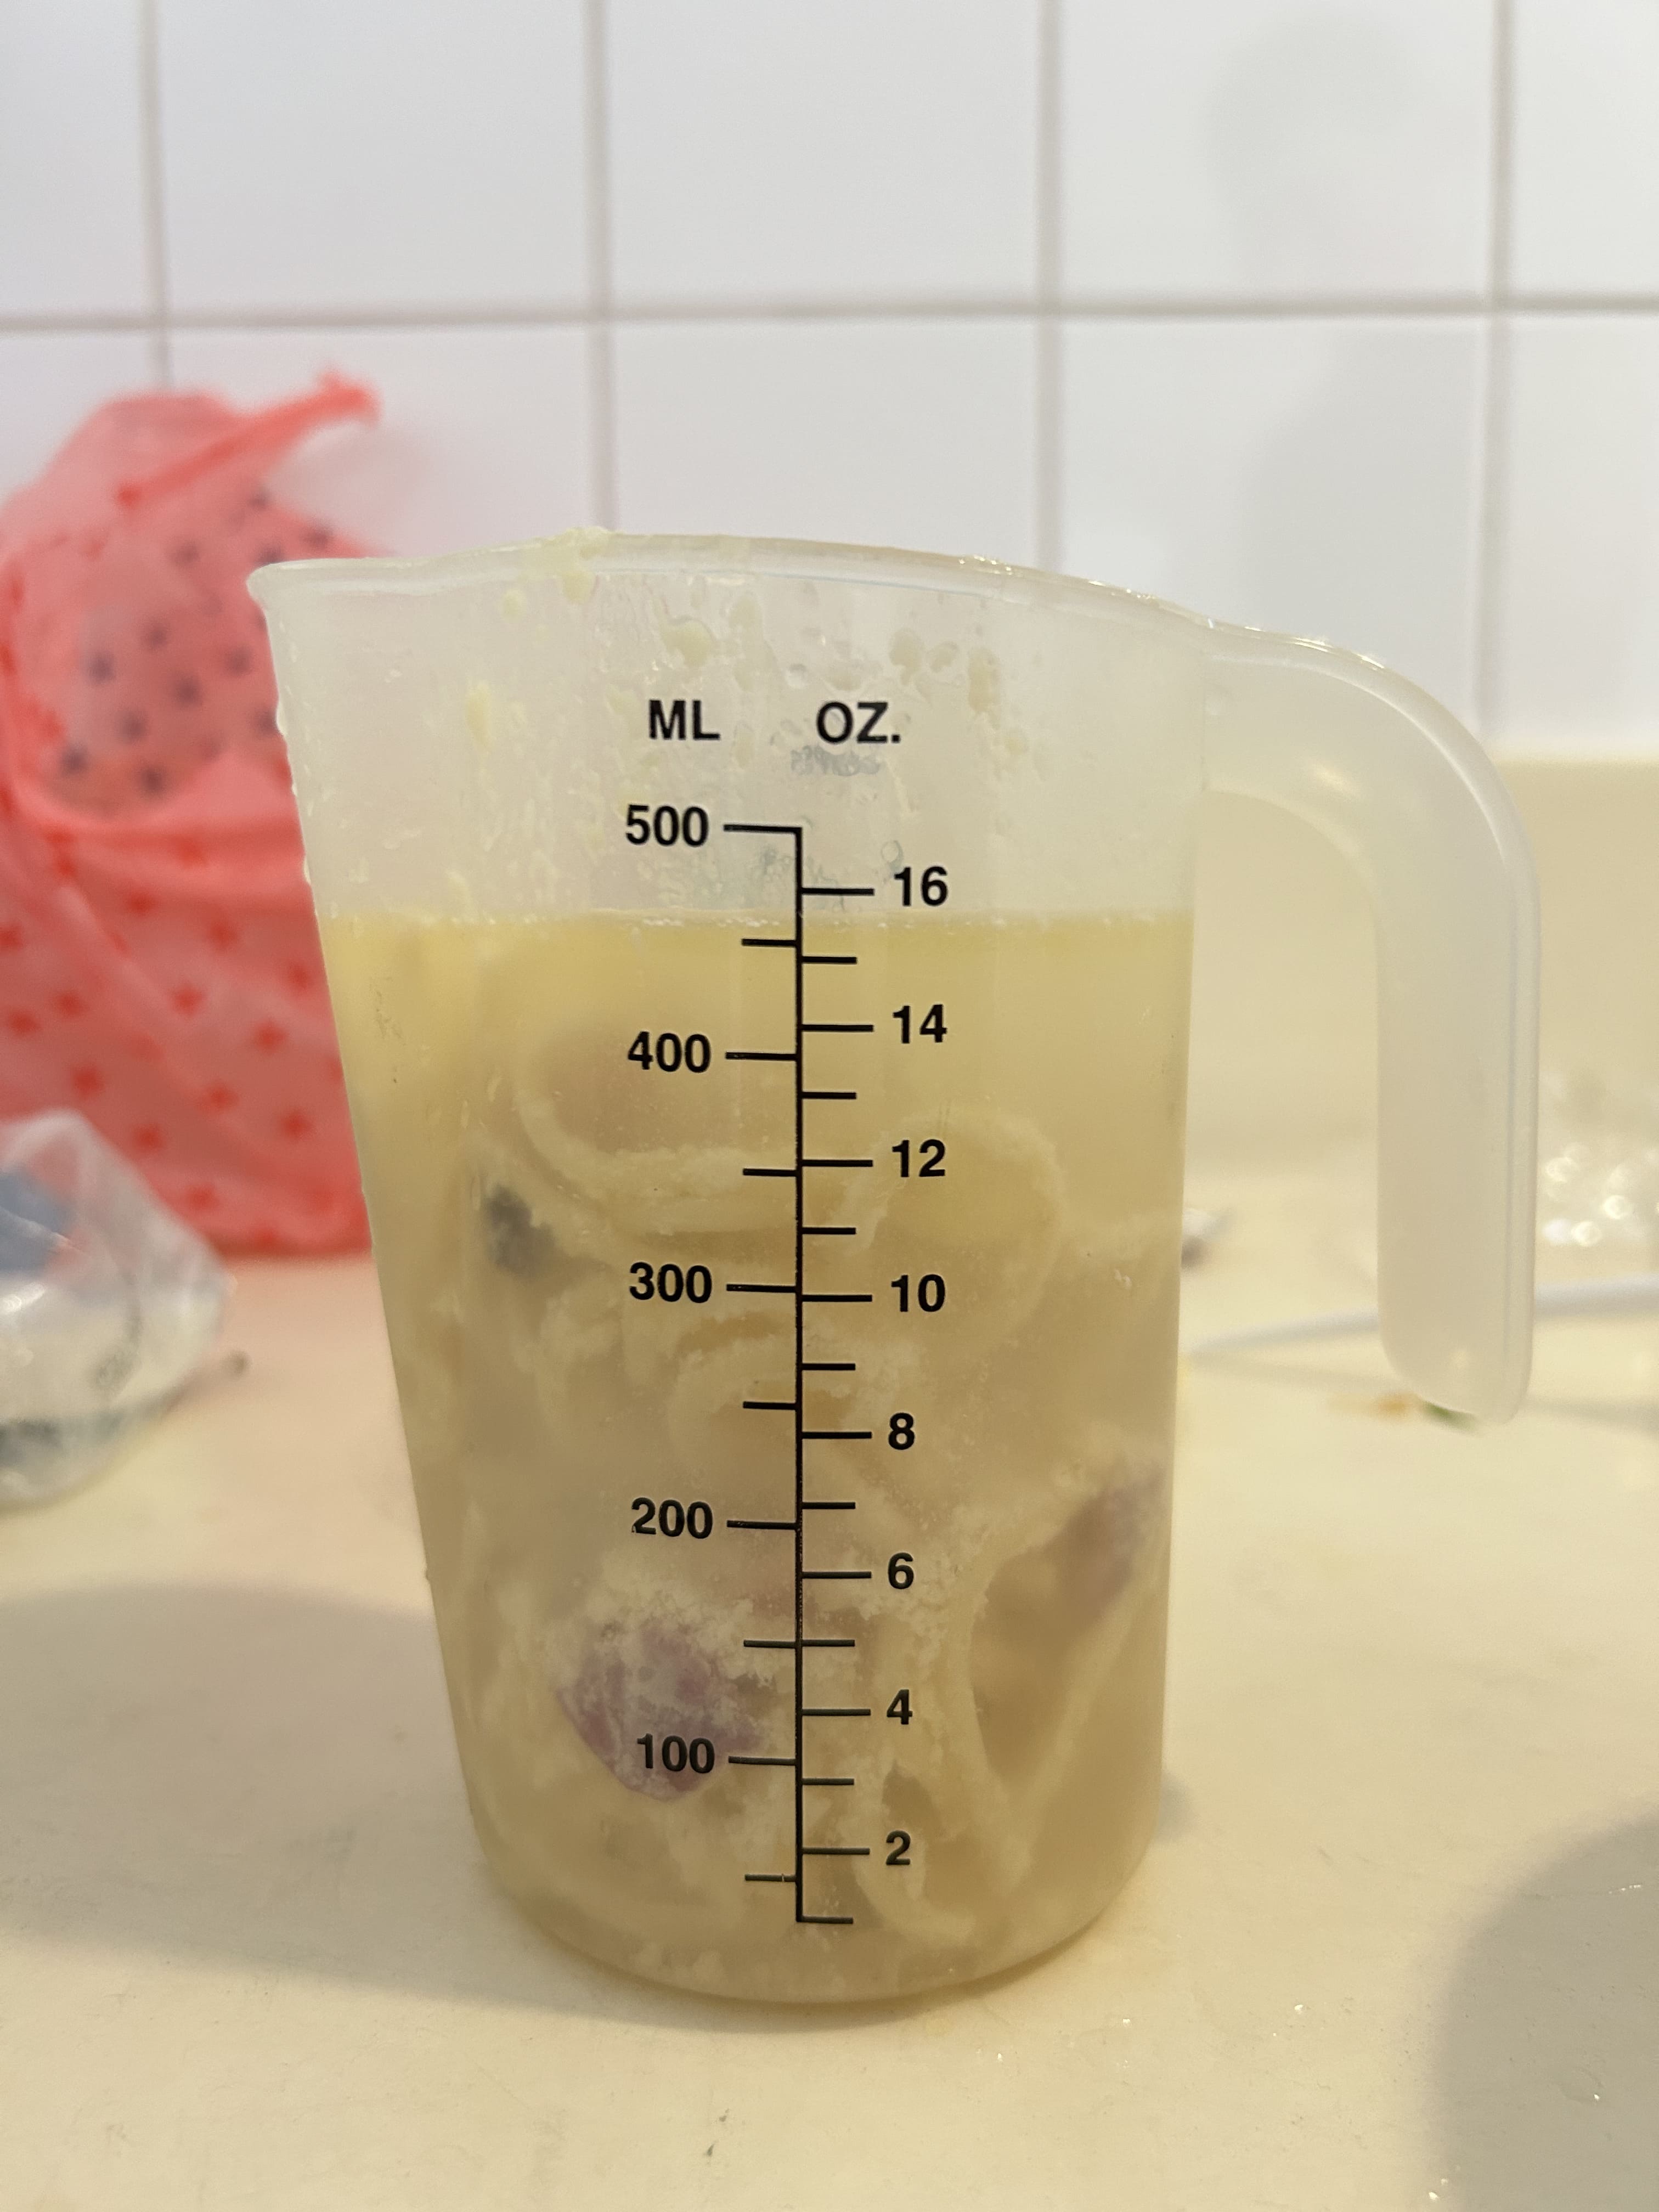
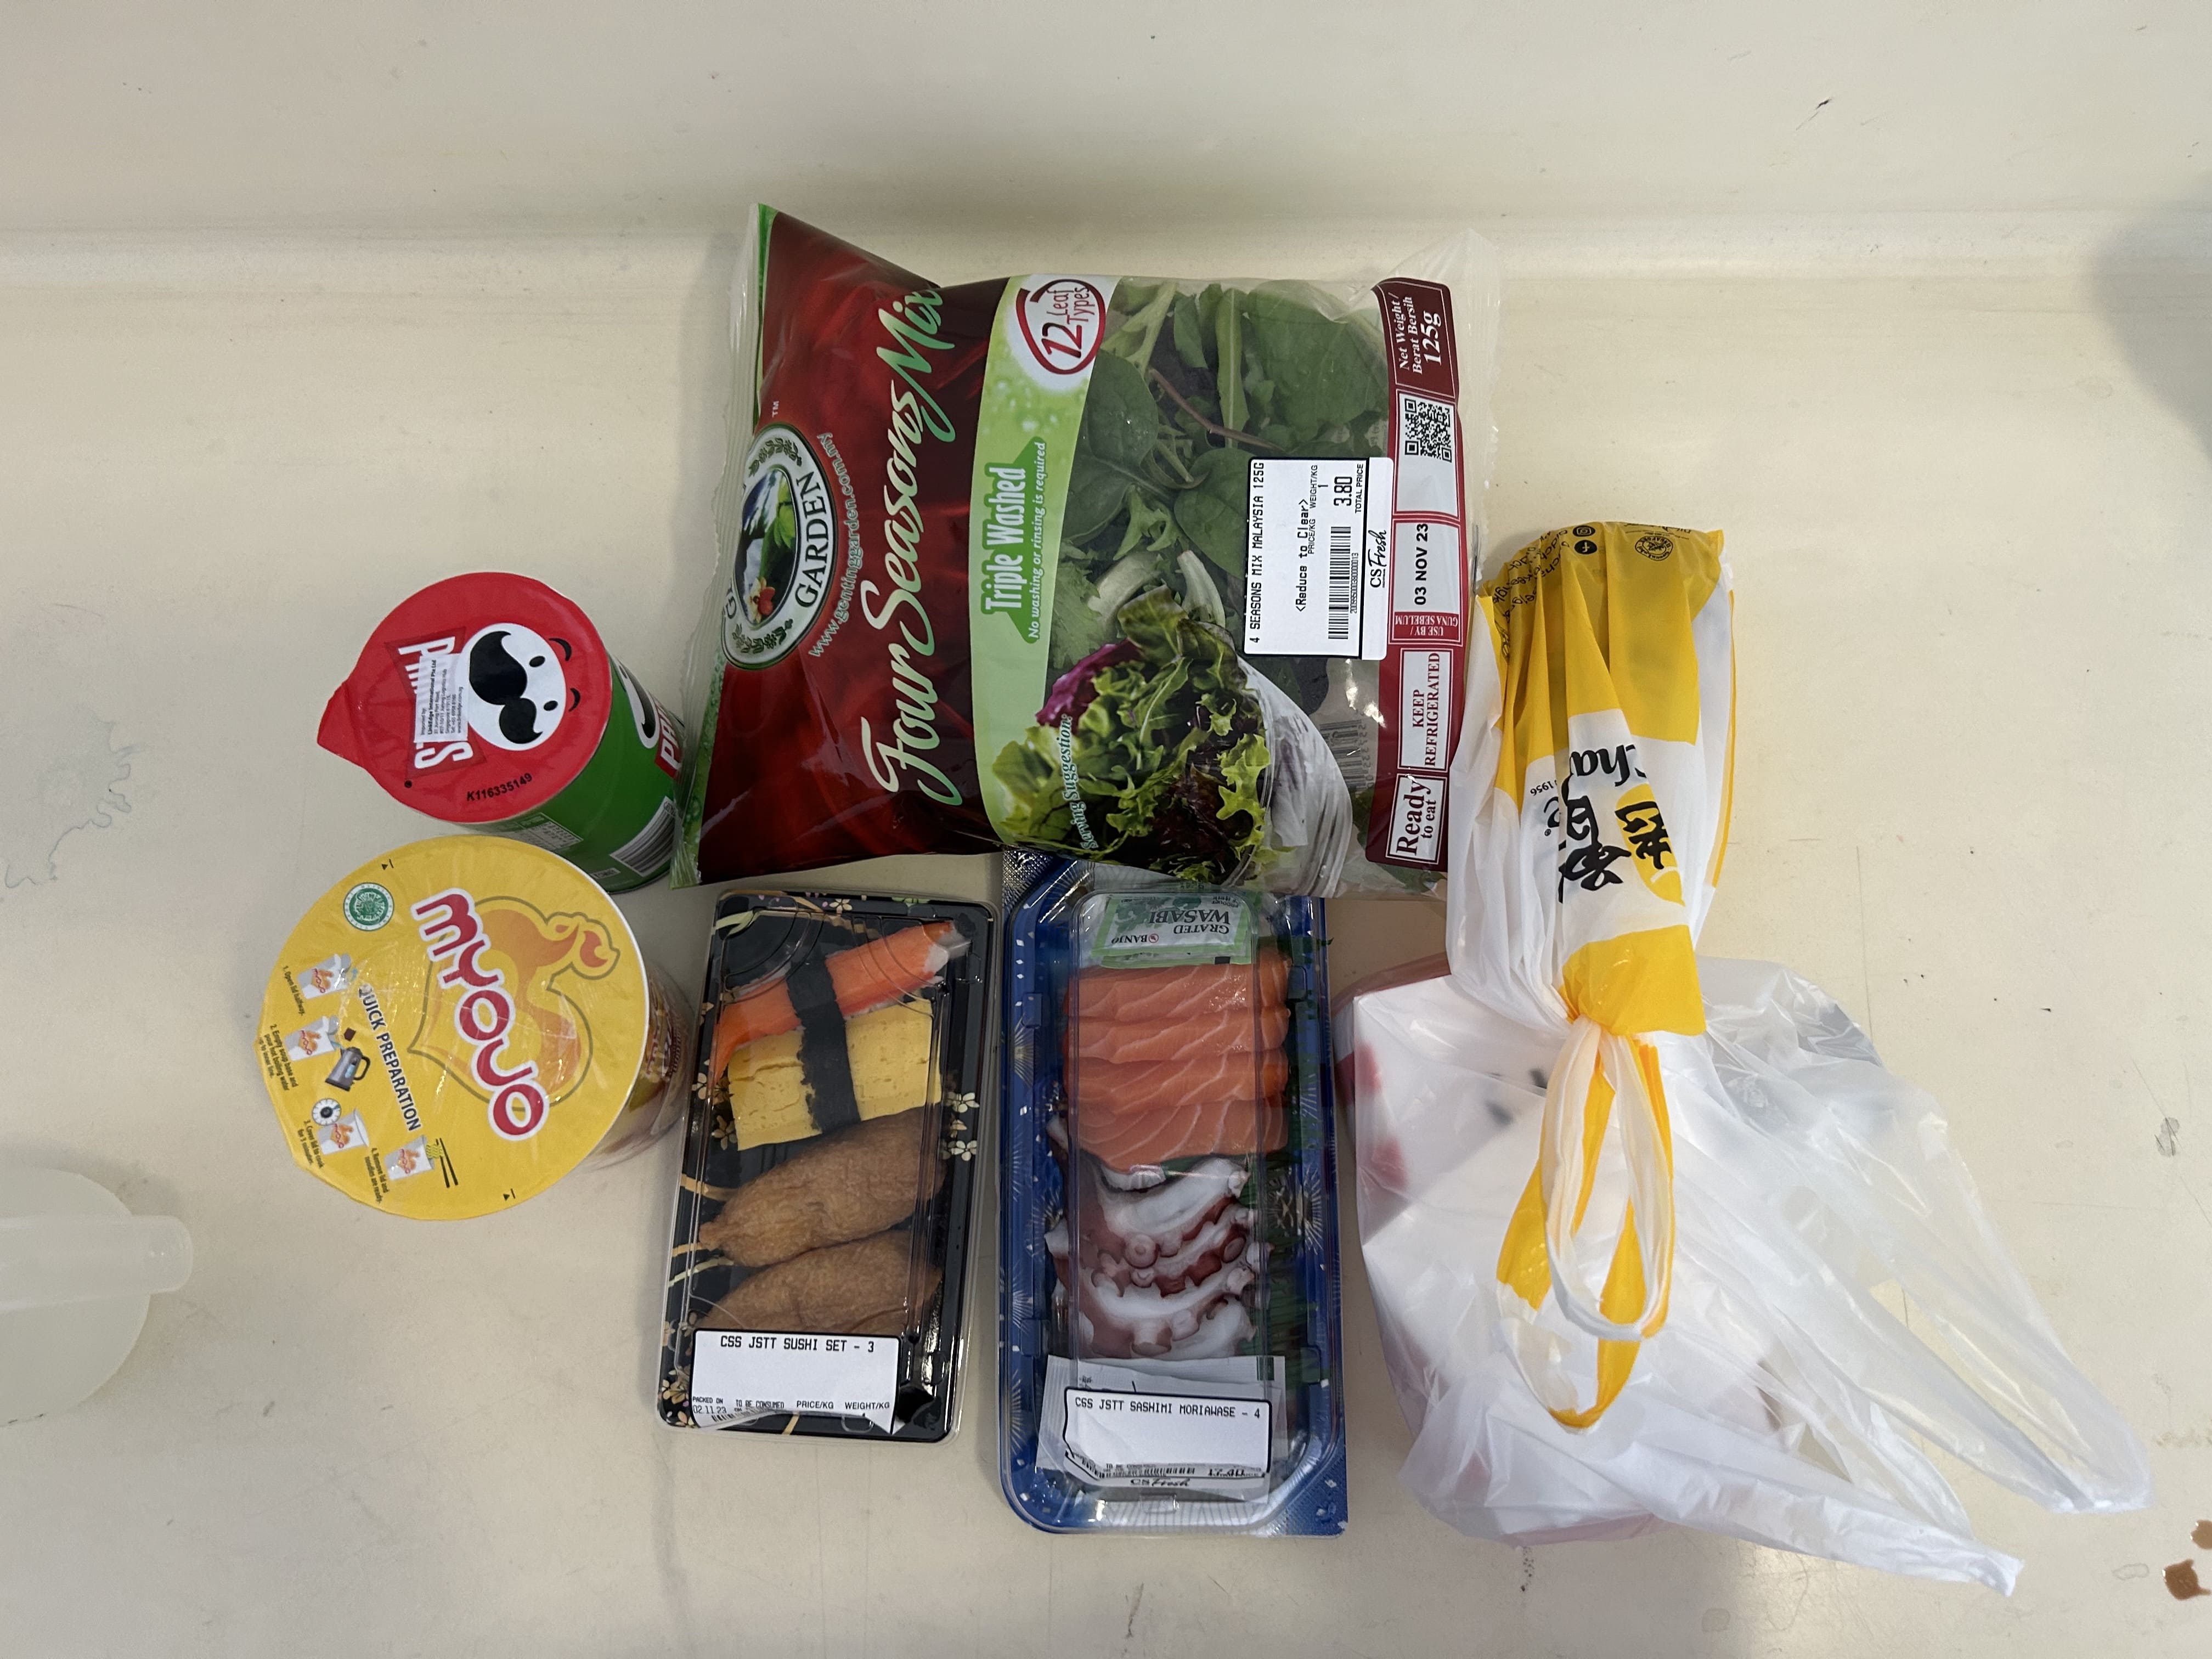
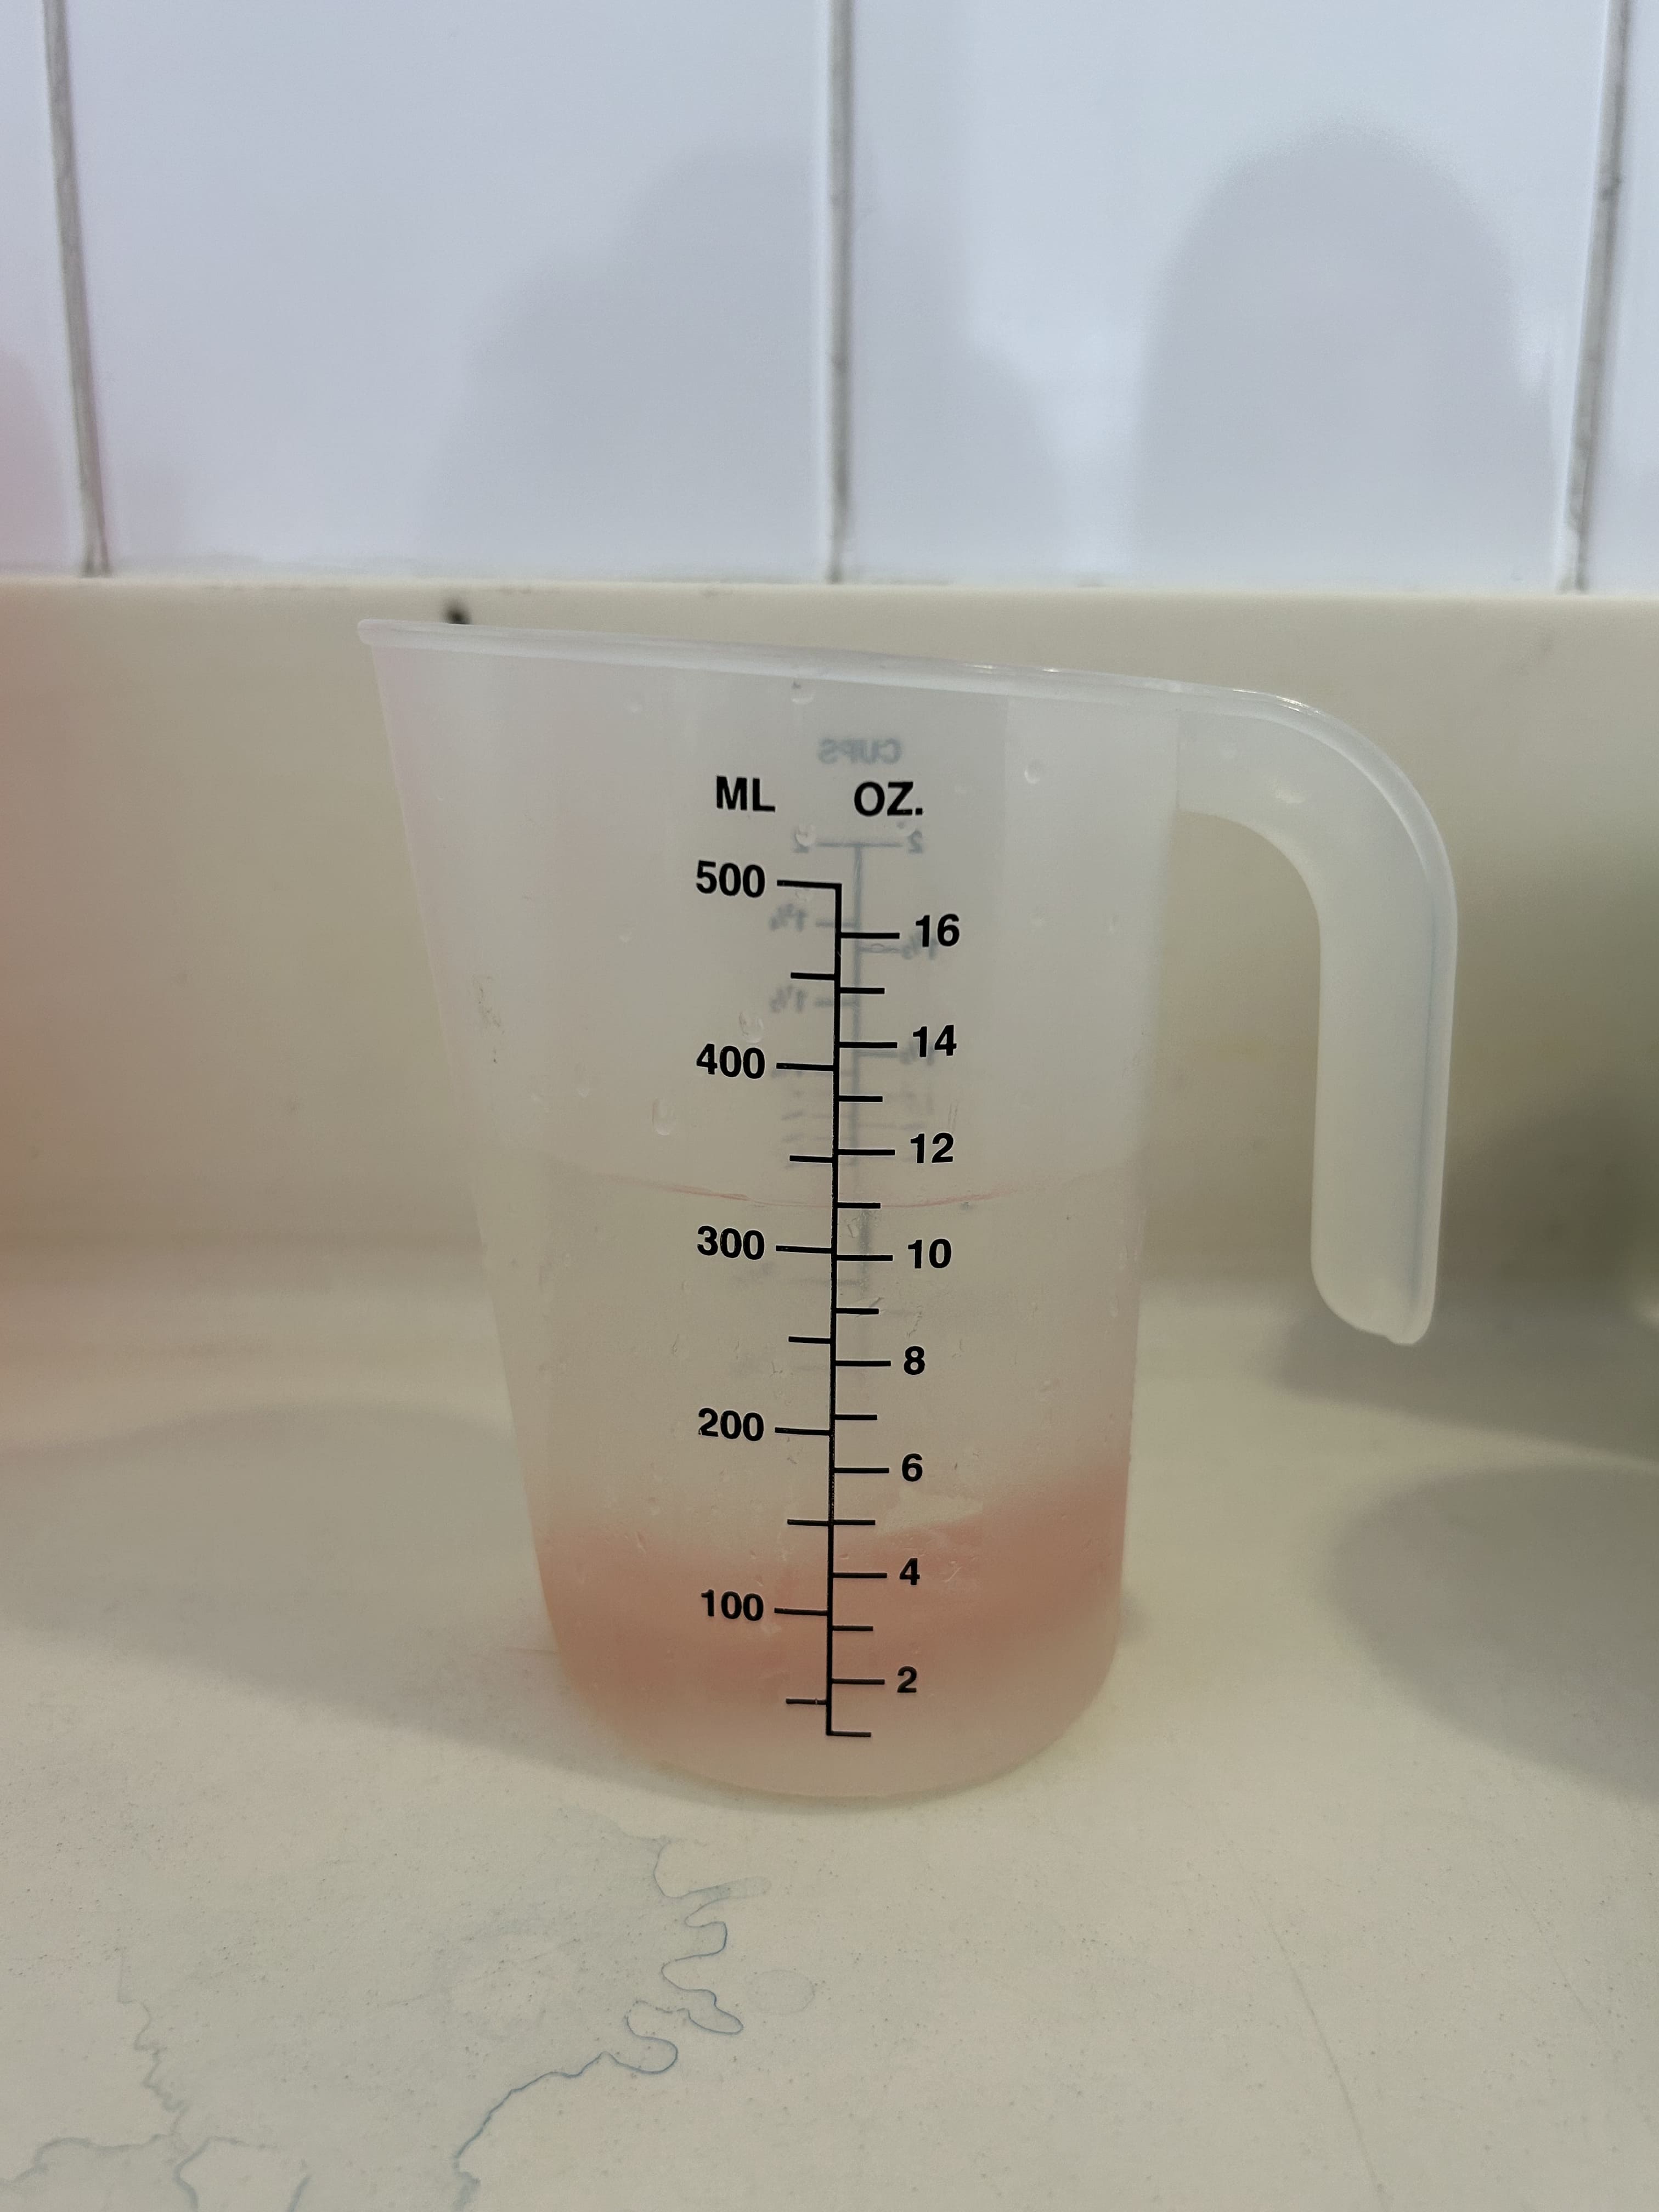
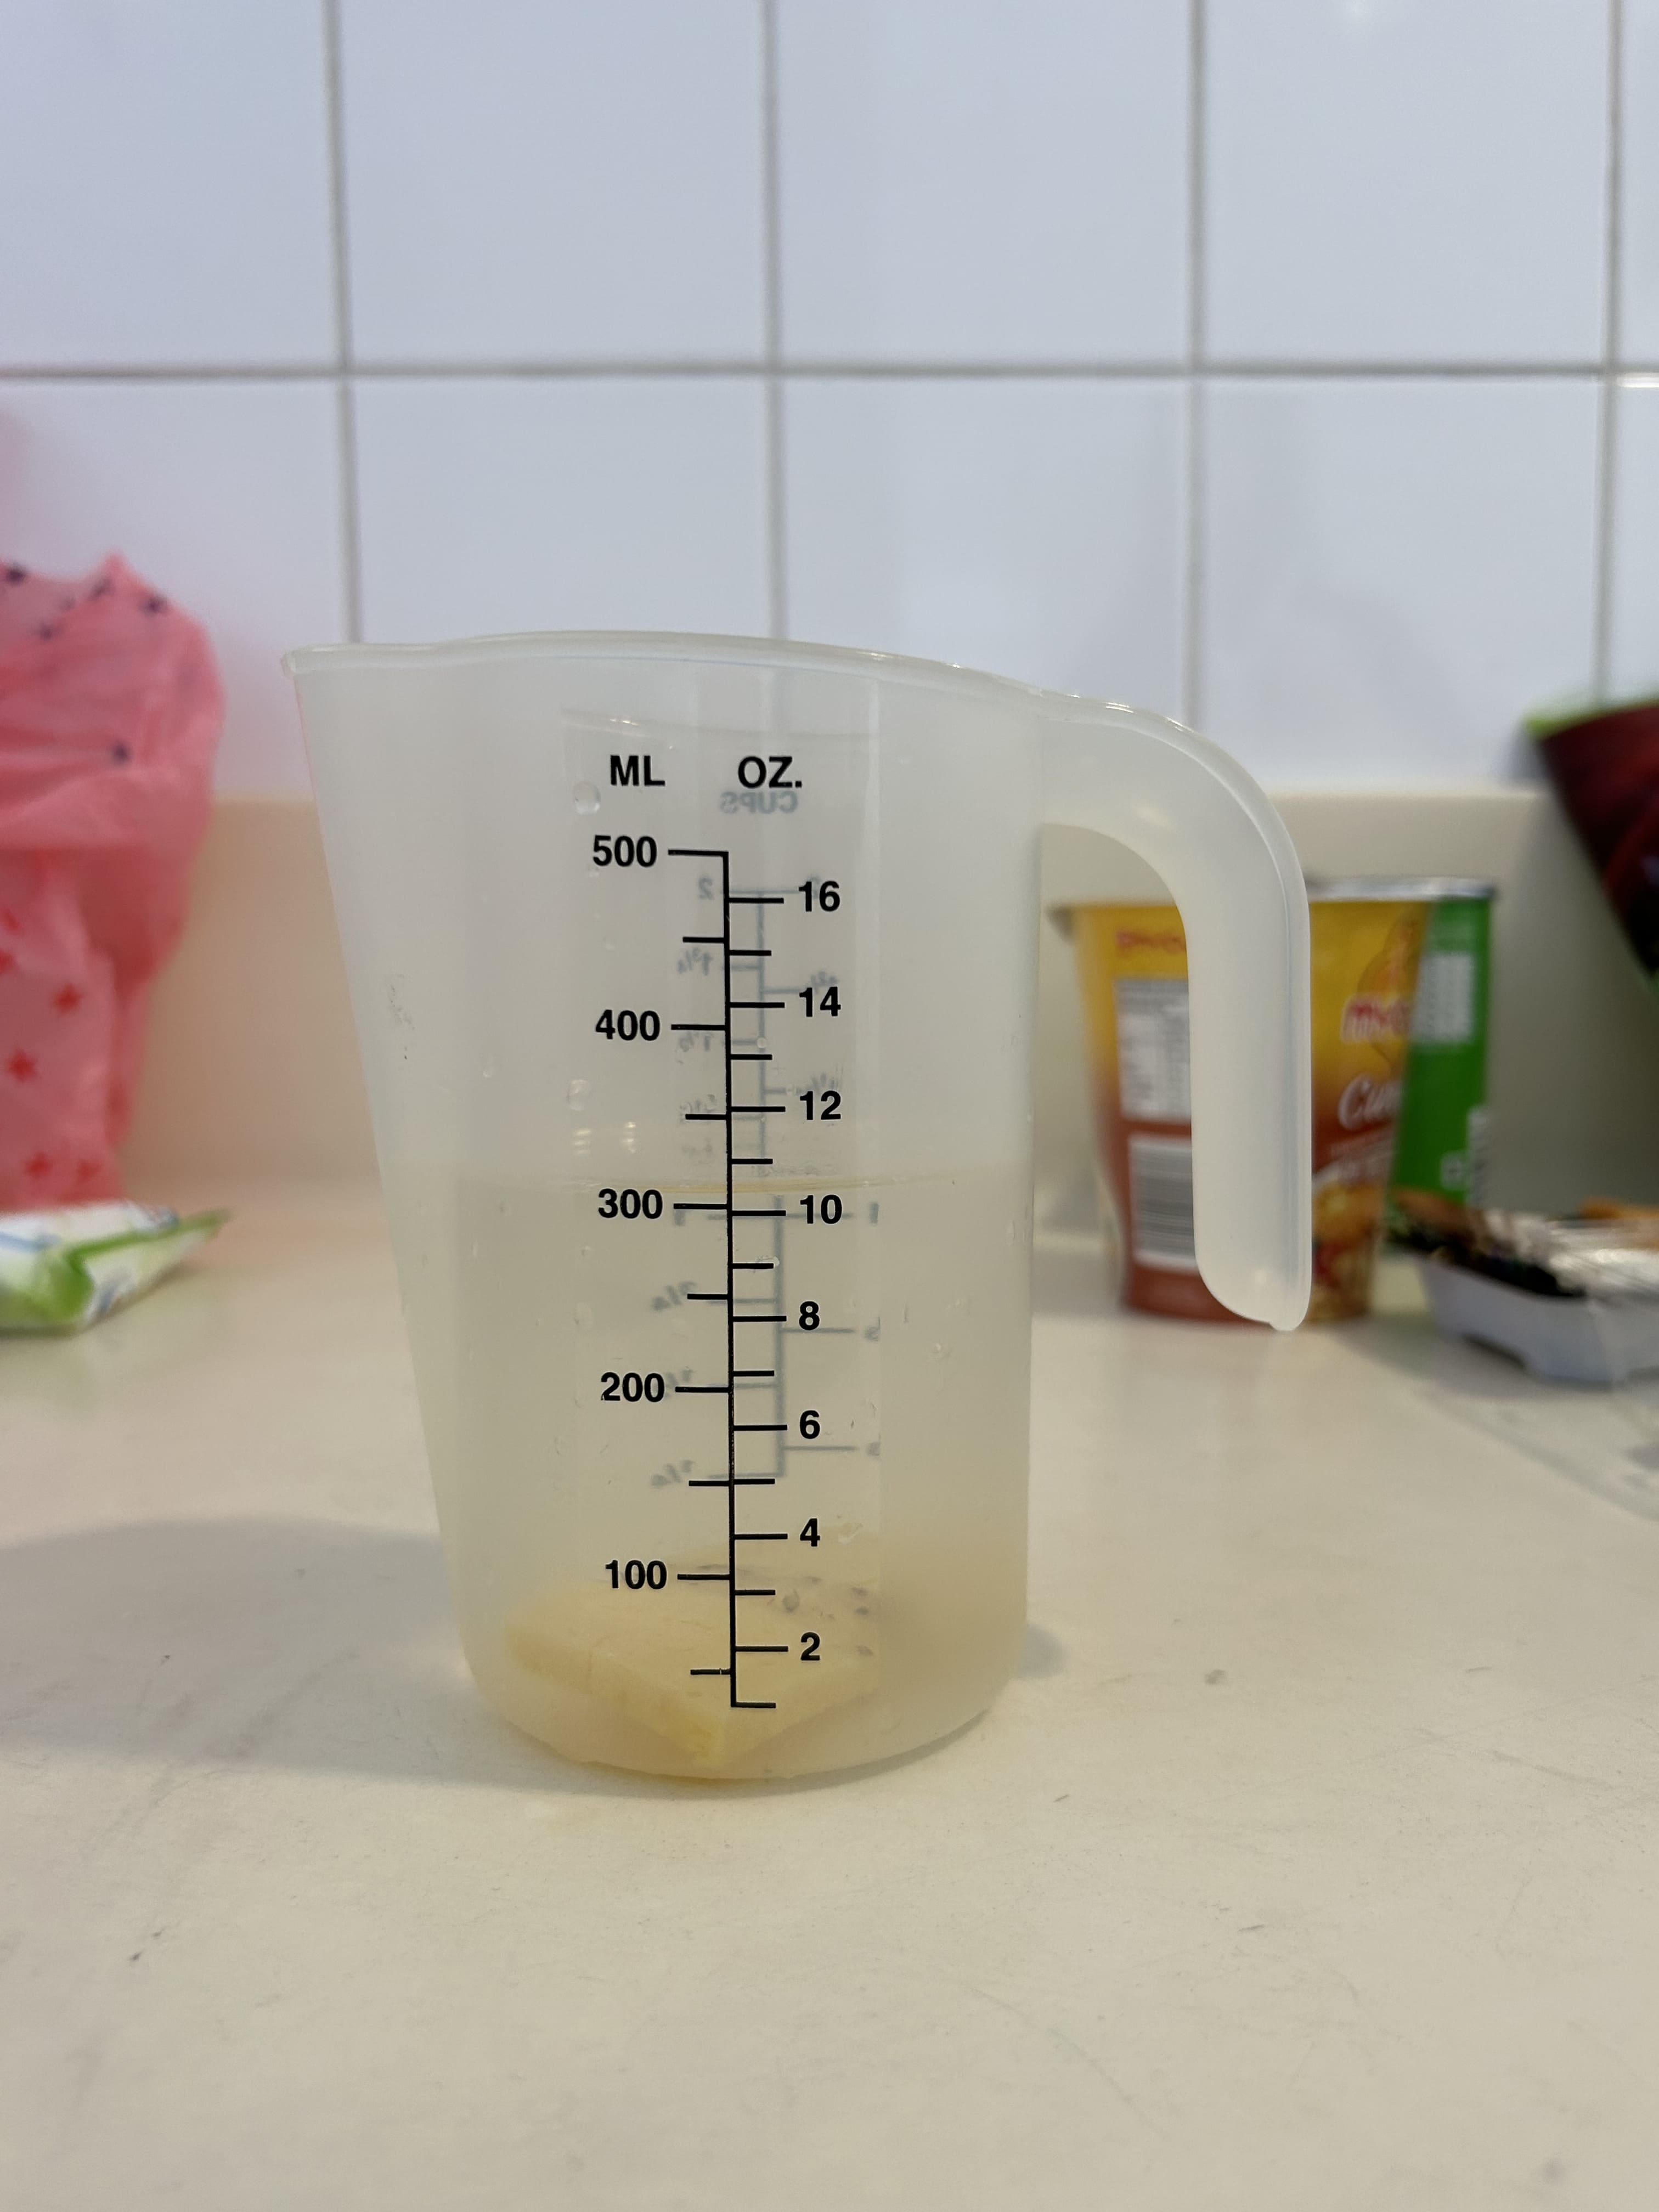
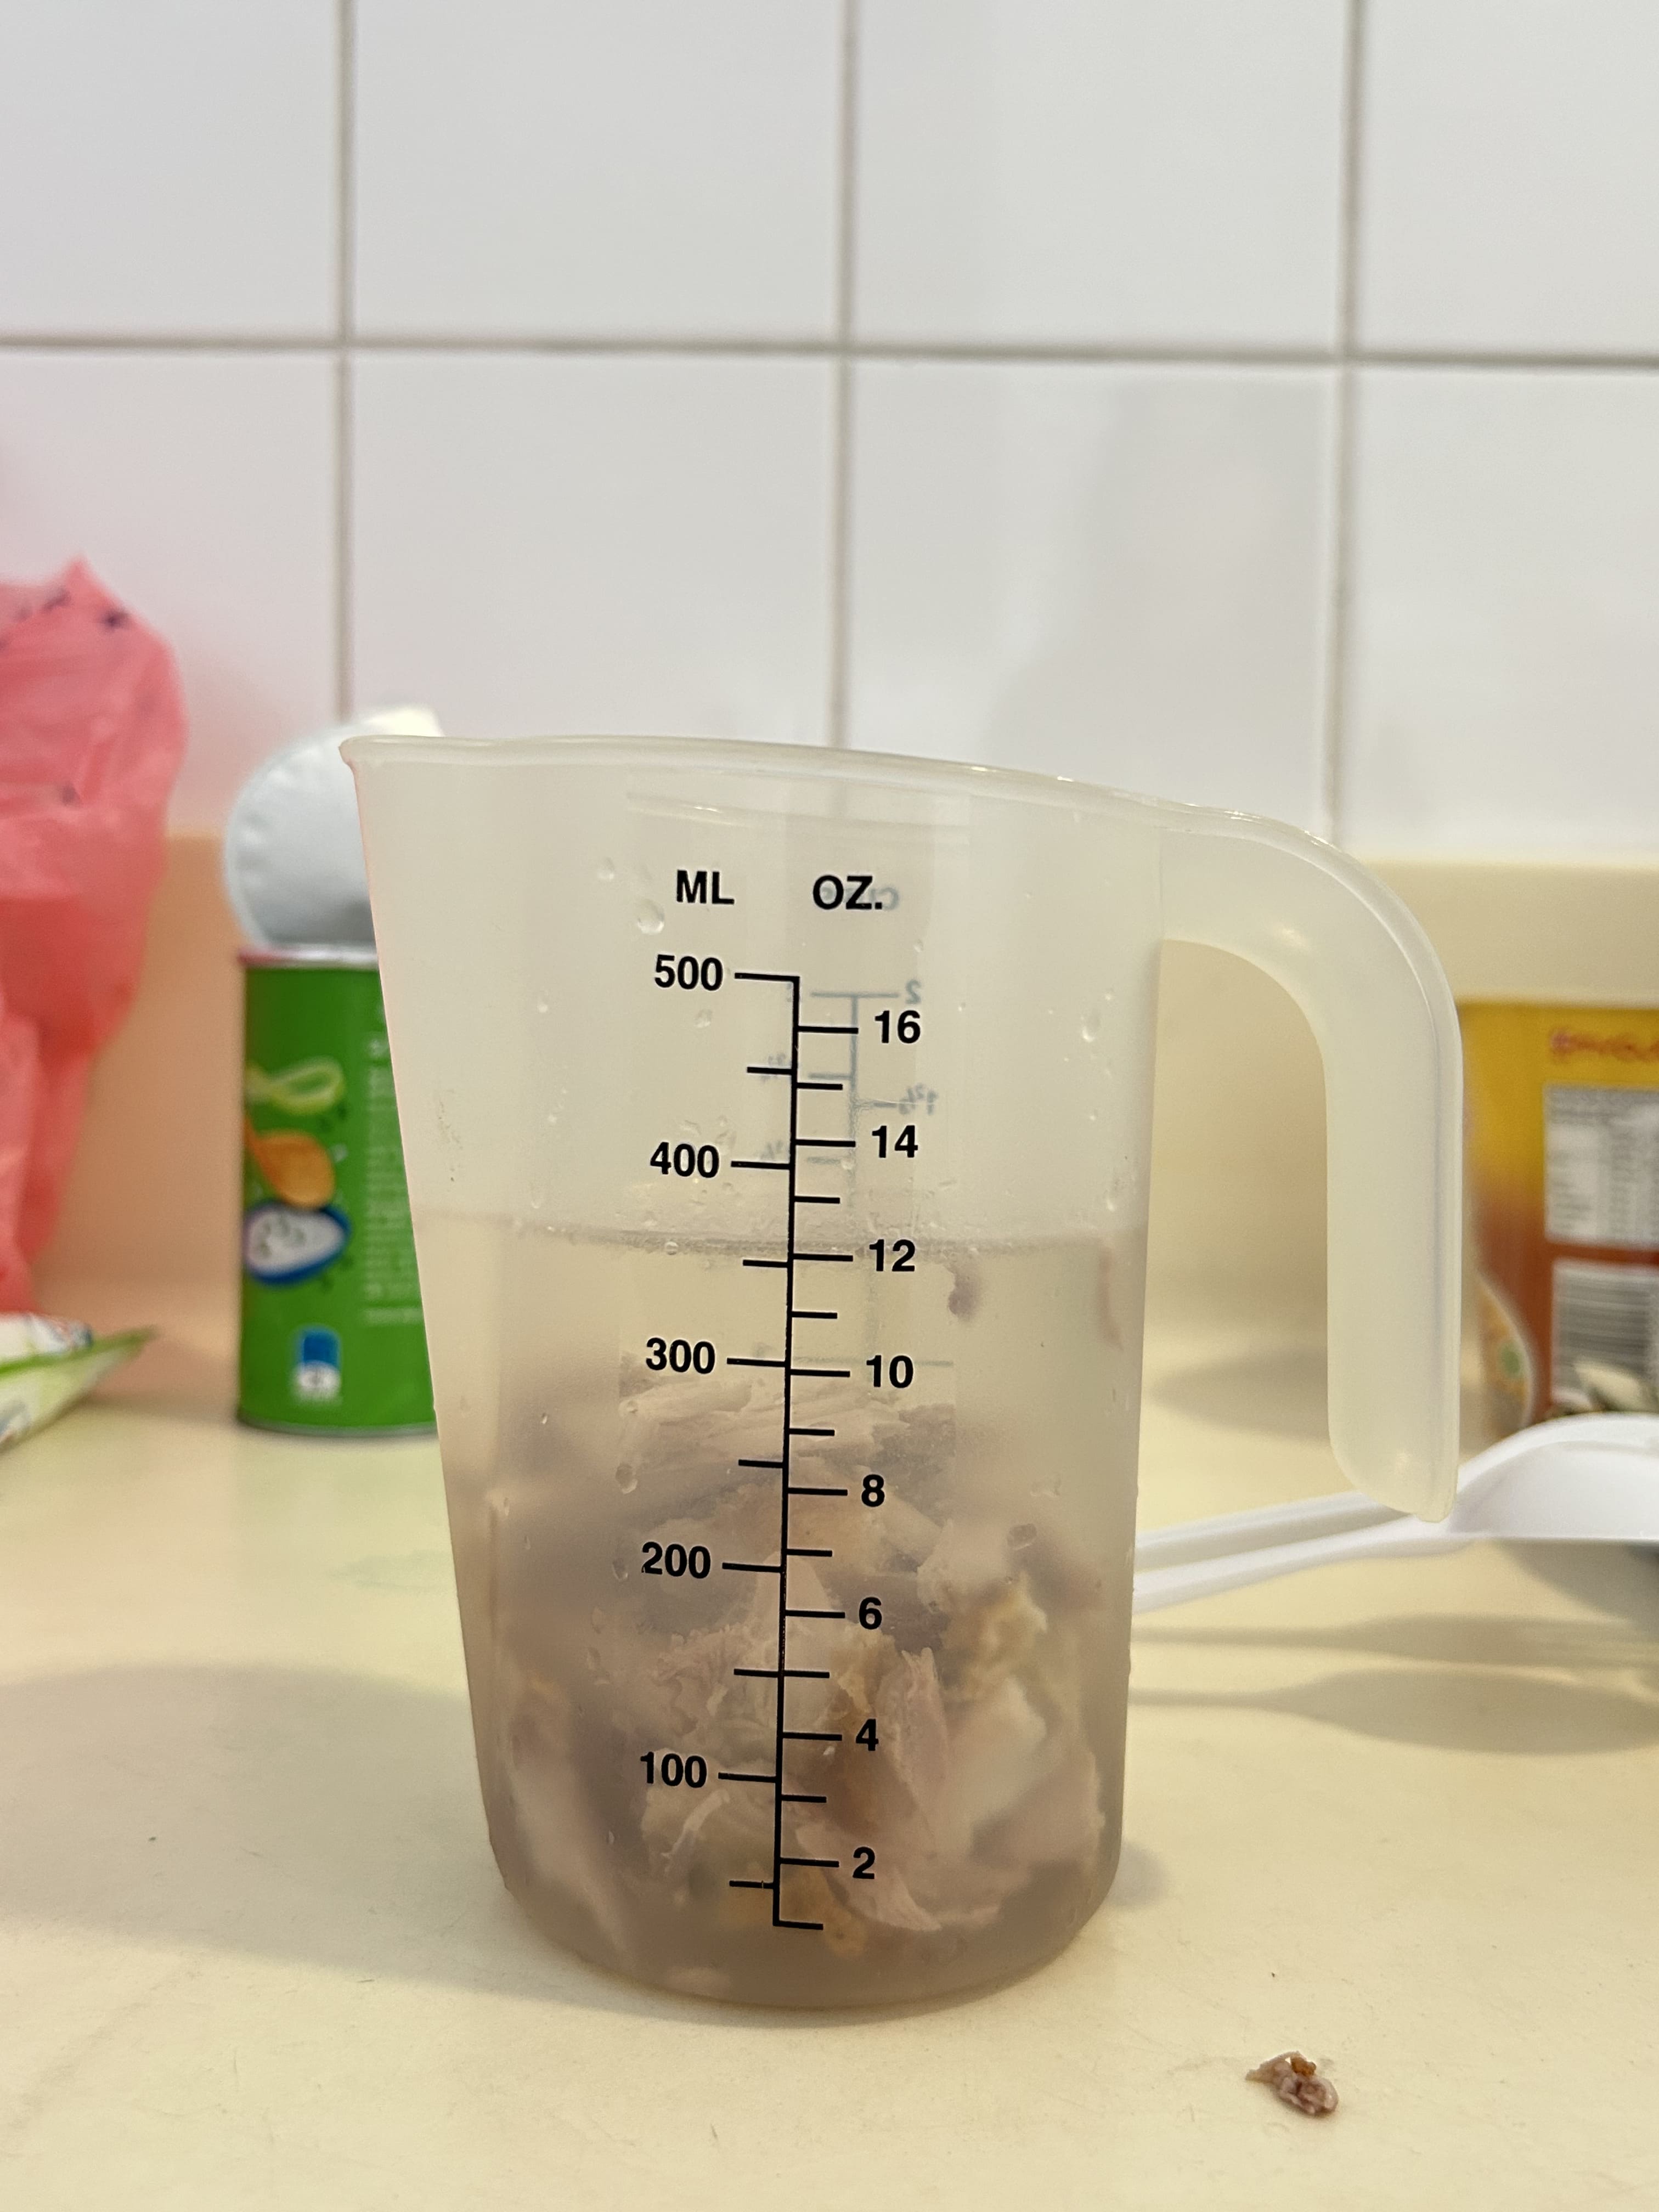
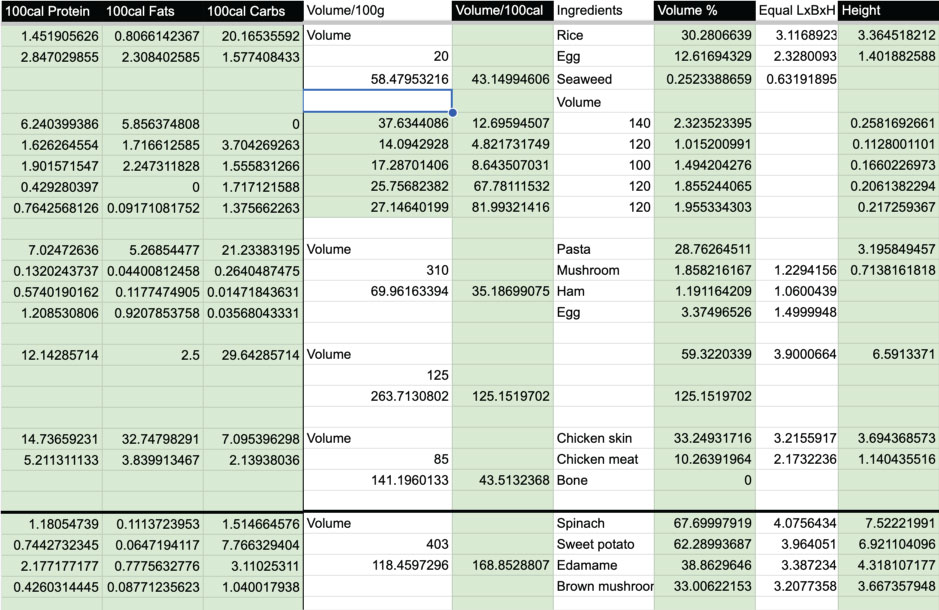
After parsing through the data for the first time, there was a challenge in finding out how much space the food item should occupy on the plate. Initially, we planned to use phototaking to determine the size, but Wei Ren forgot his SD card and it was also an inaccurate measurement since the method did not account for the height. We decided to repurchase all the food items and remeasure the weight and volume with the use of the weighing scale and a measuring beaker through water displacement.
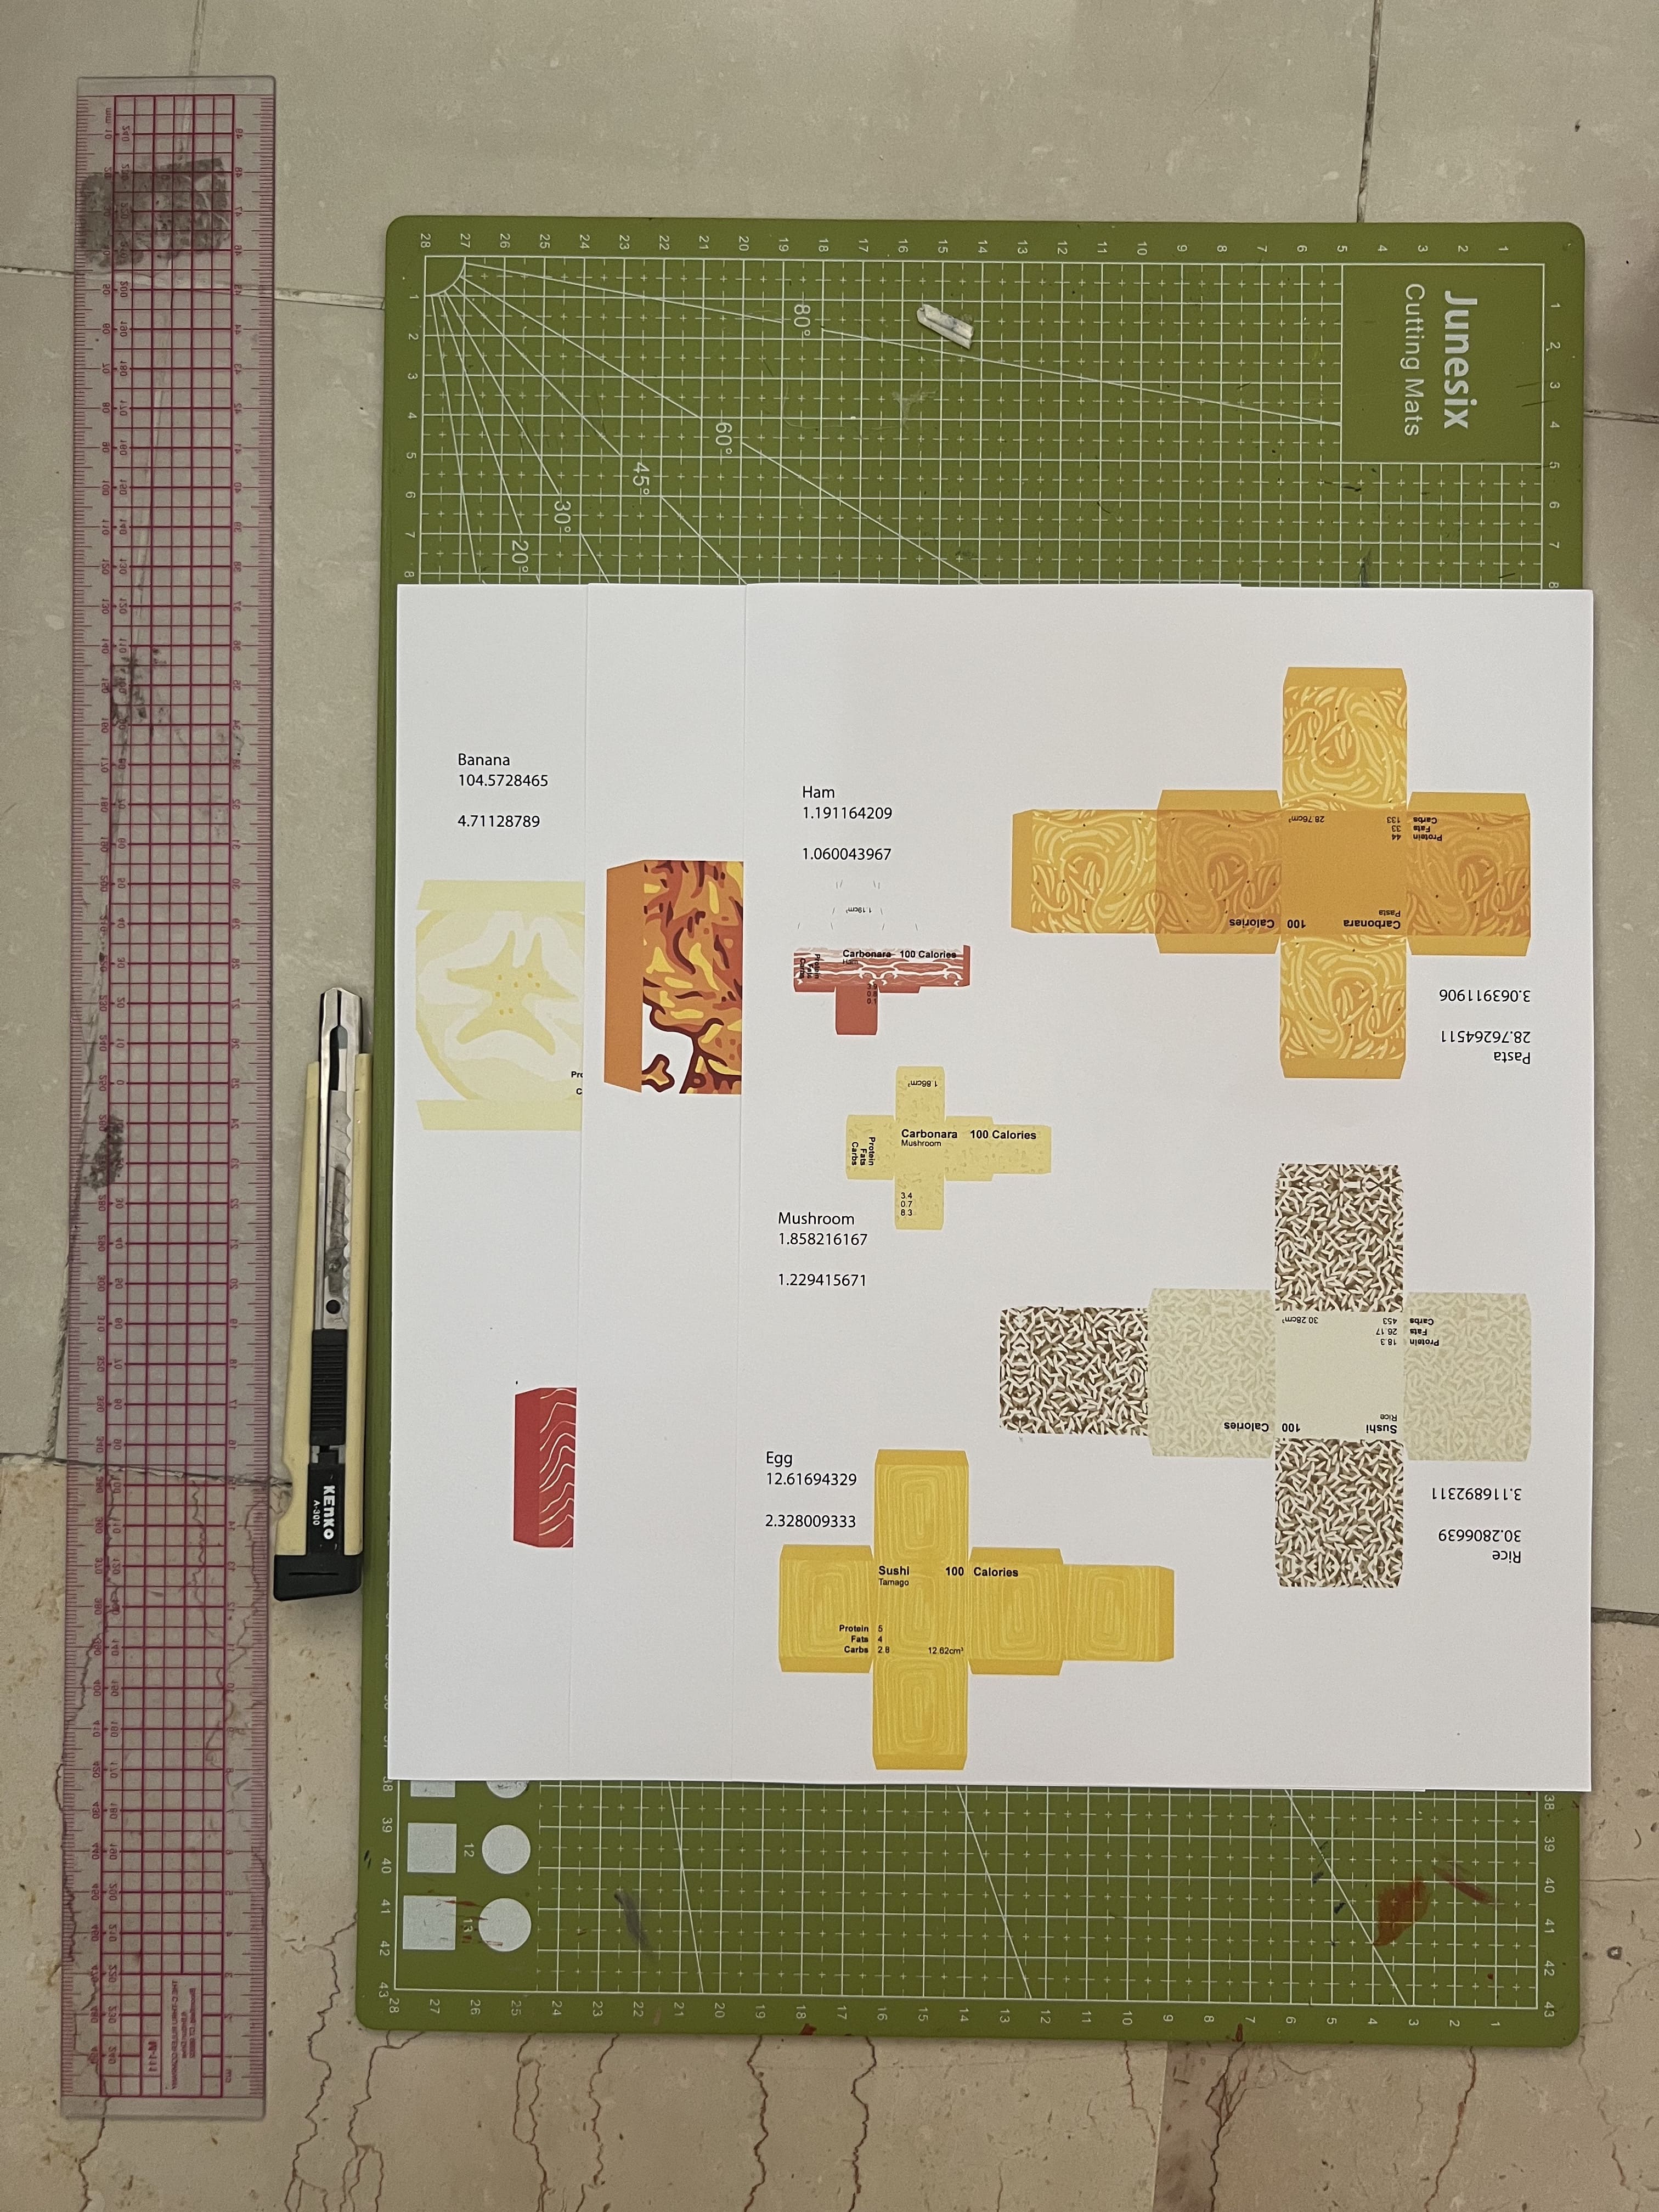
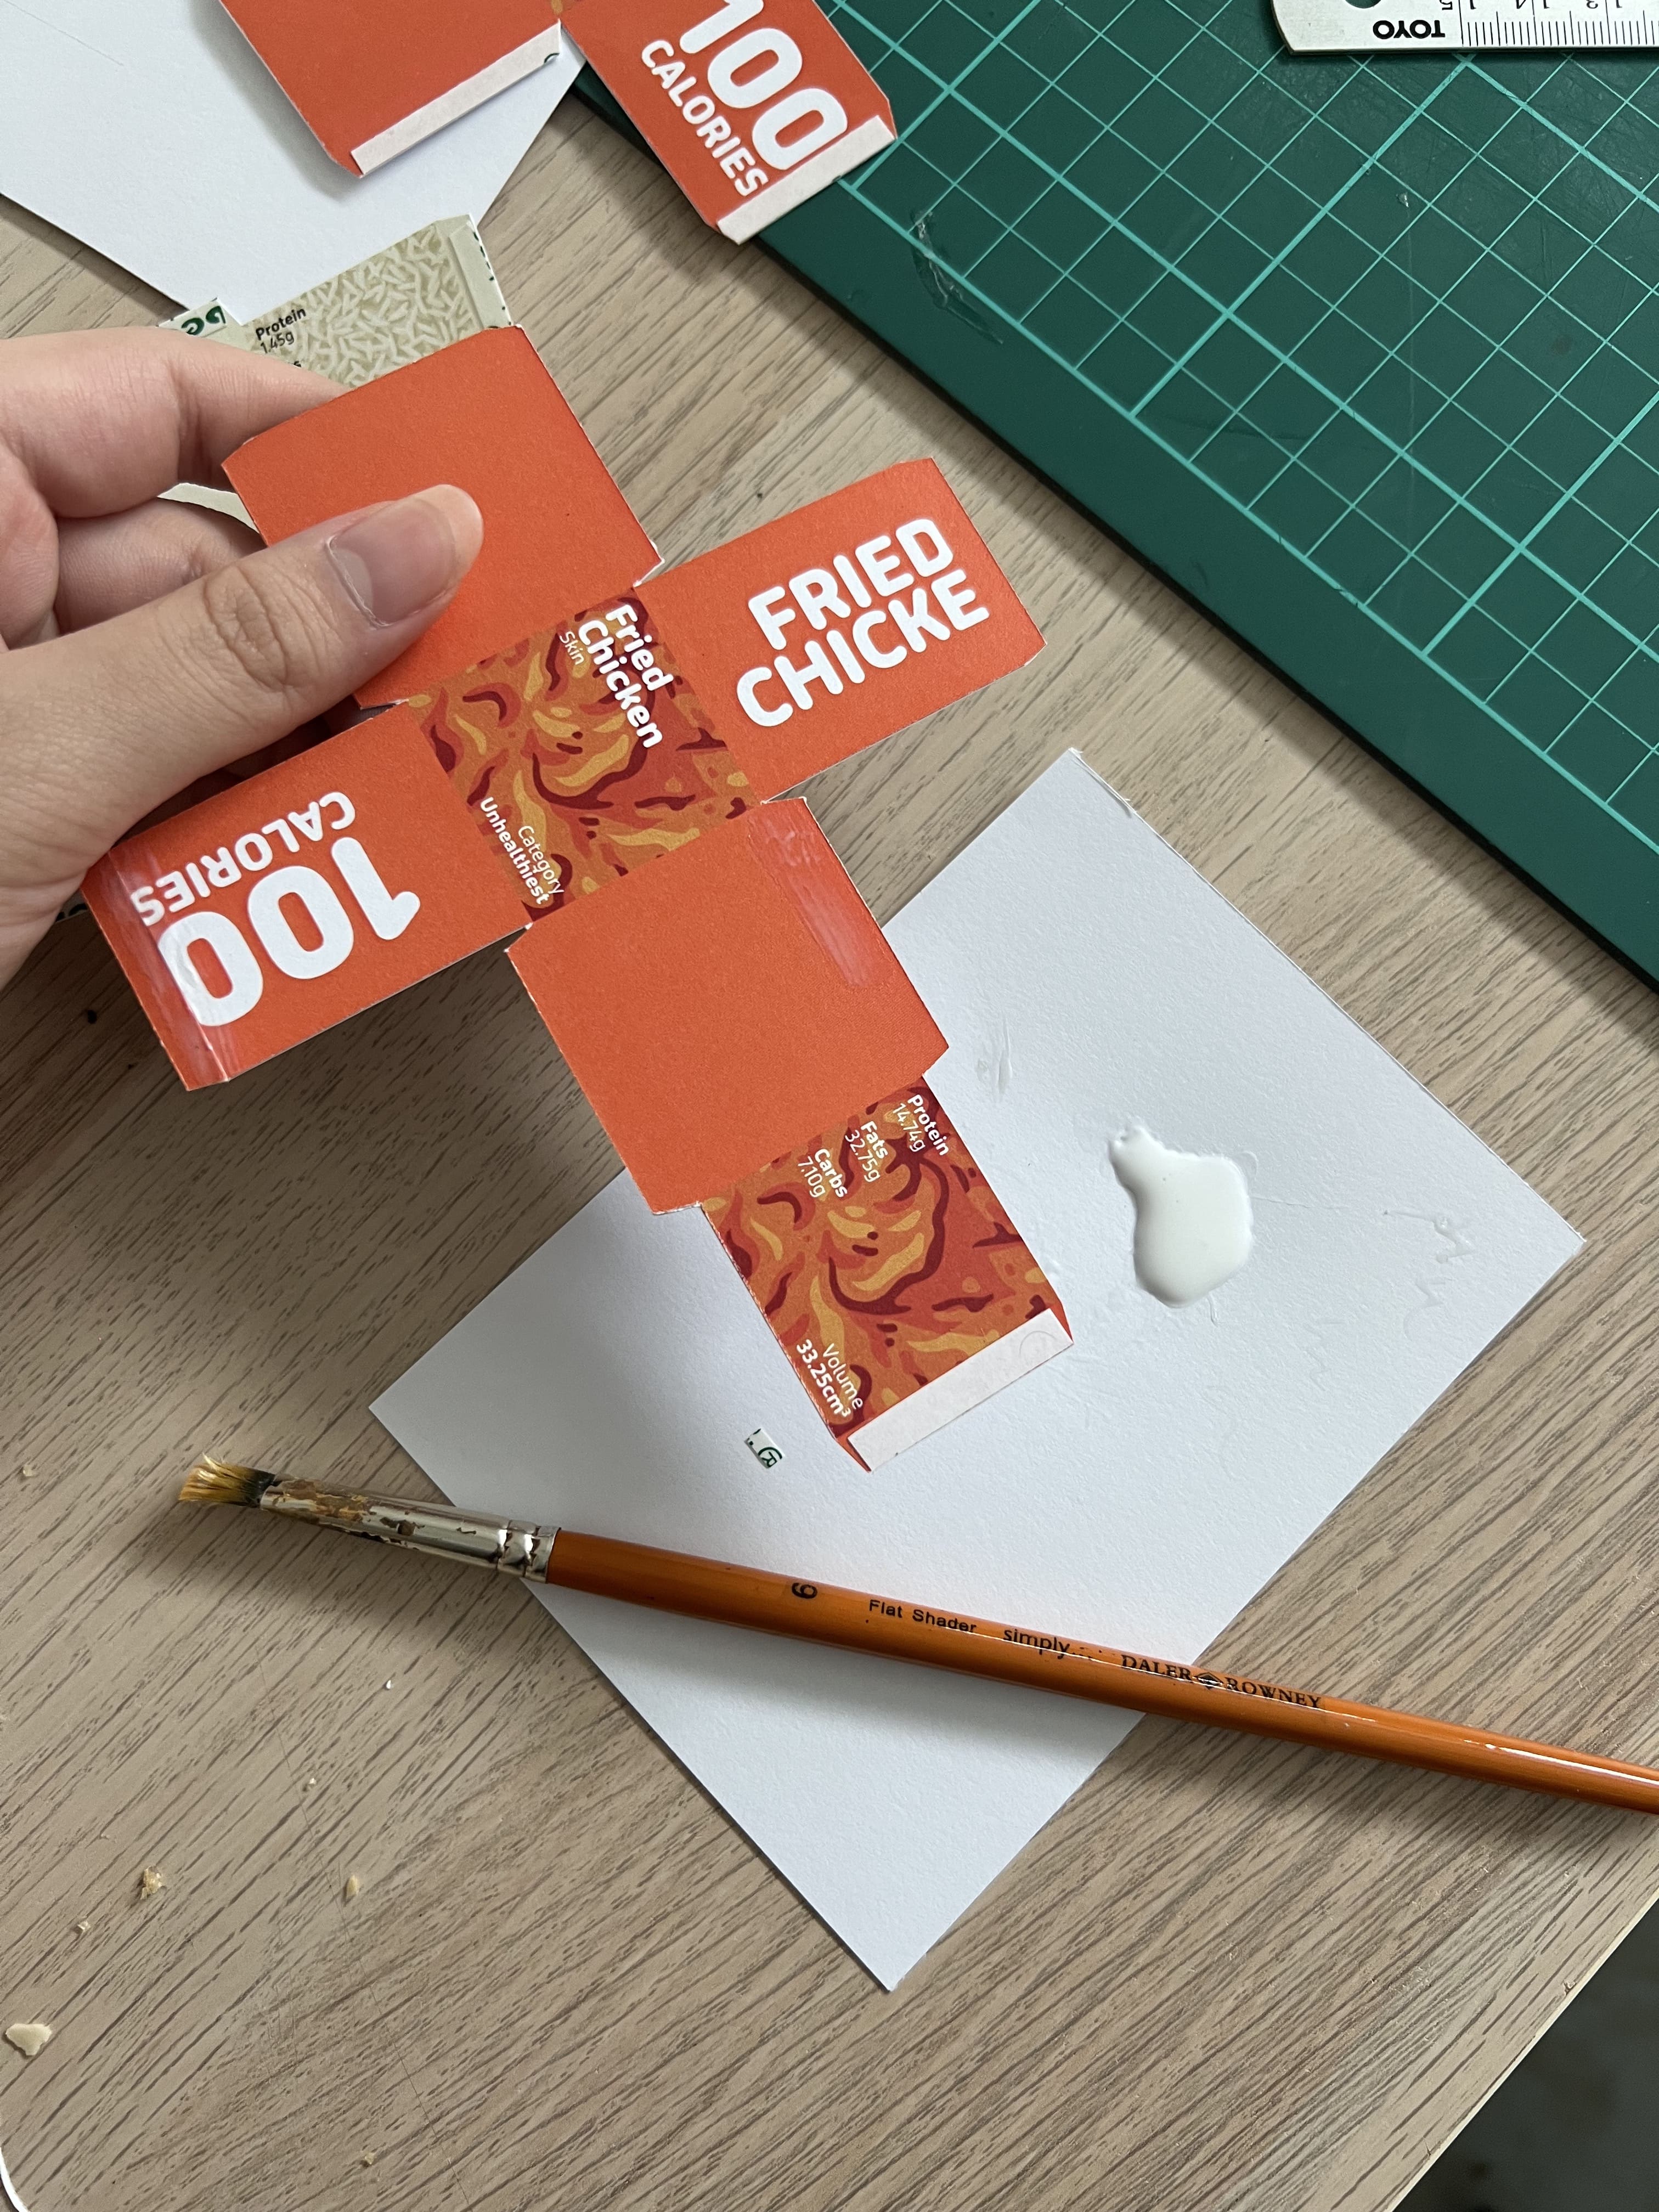
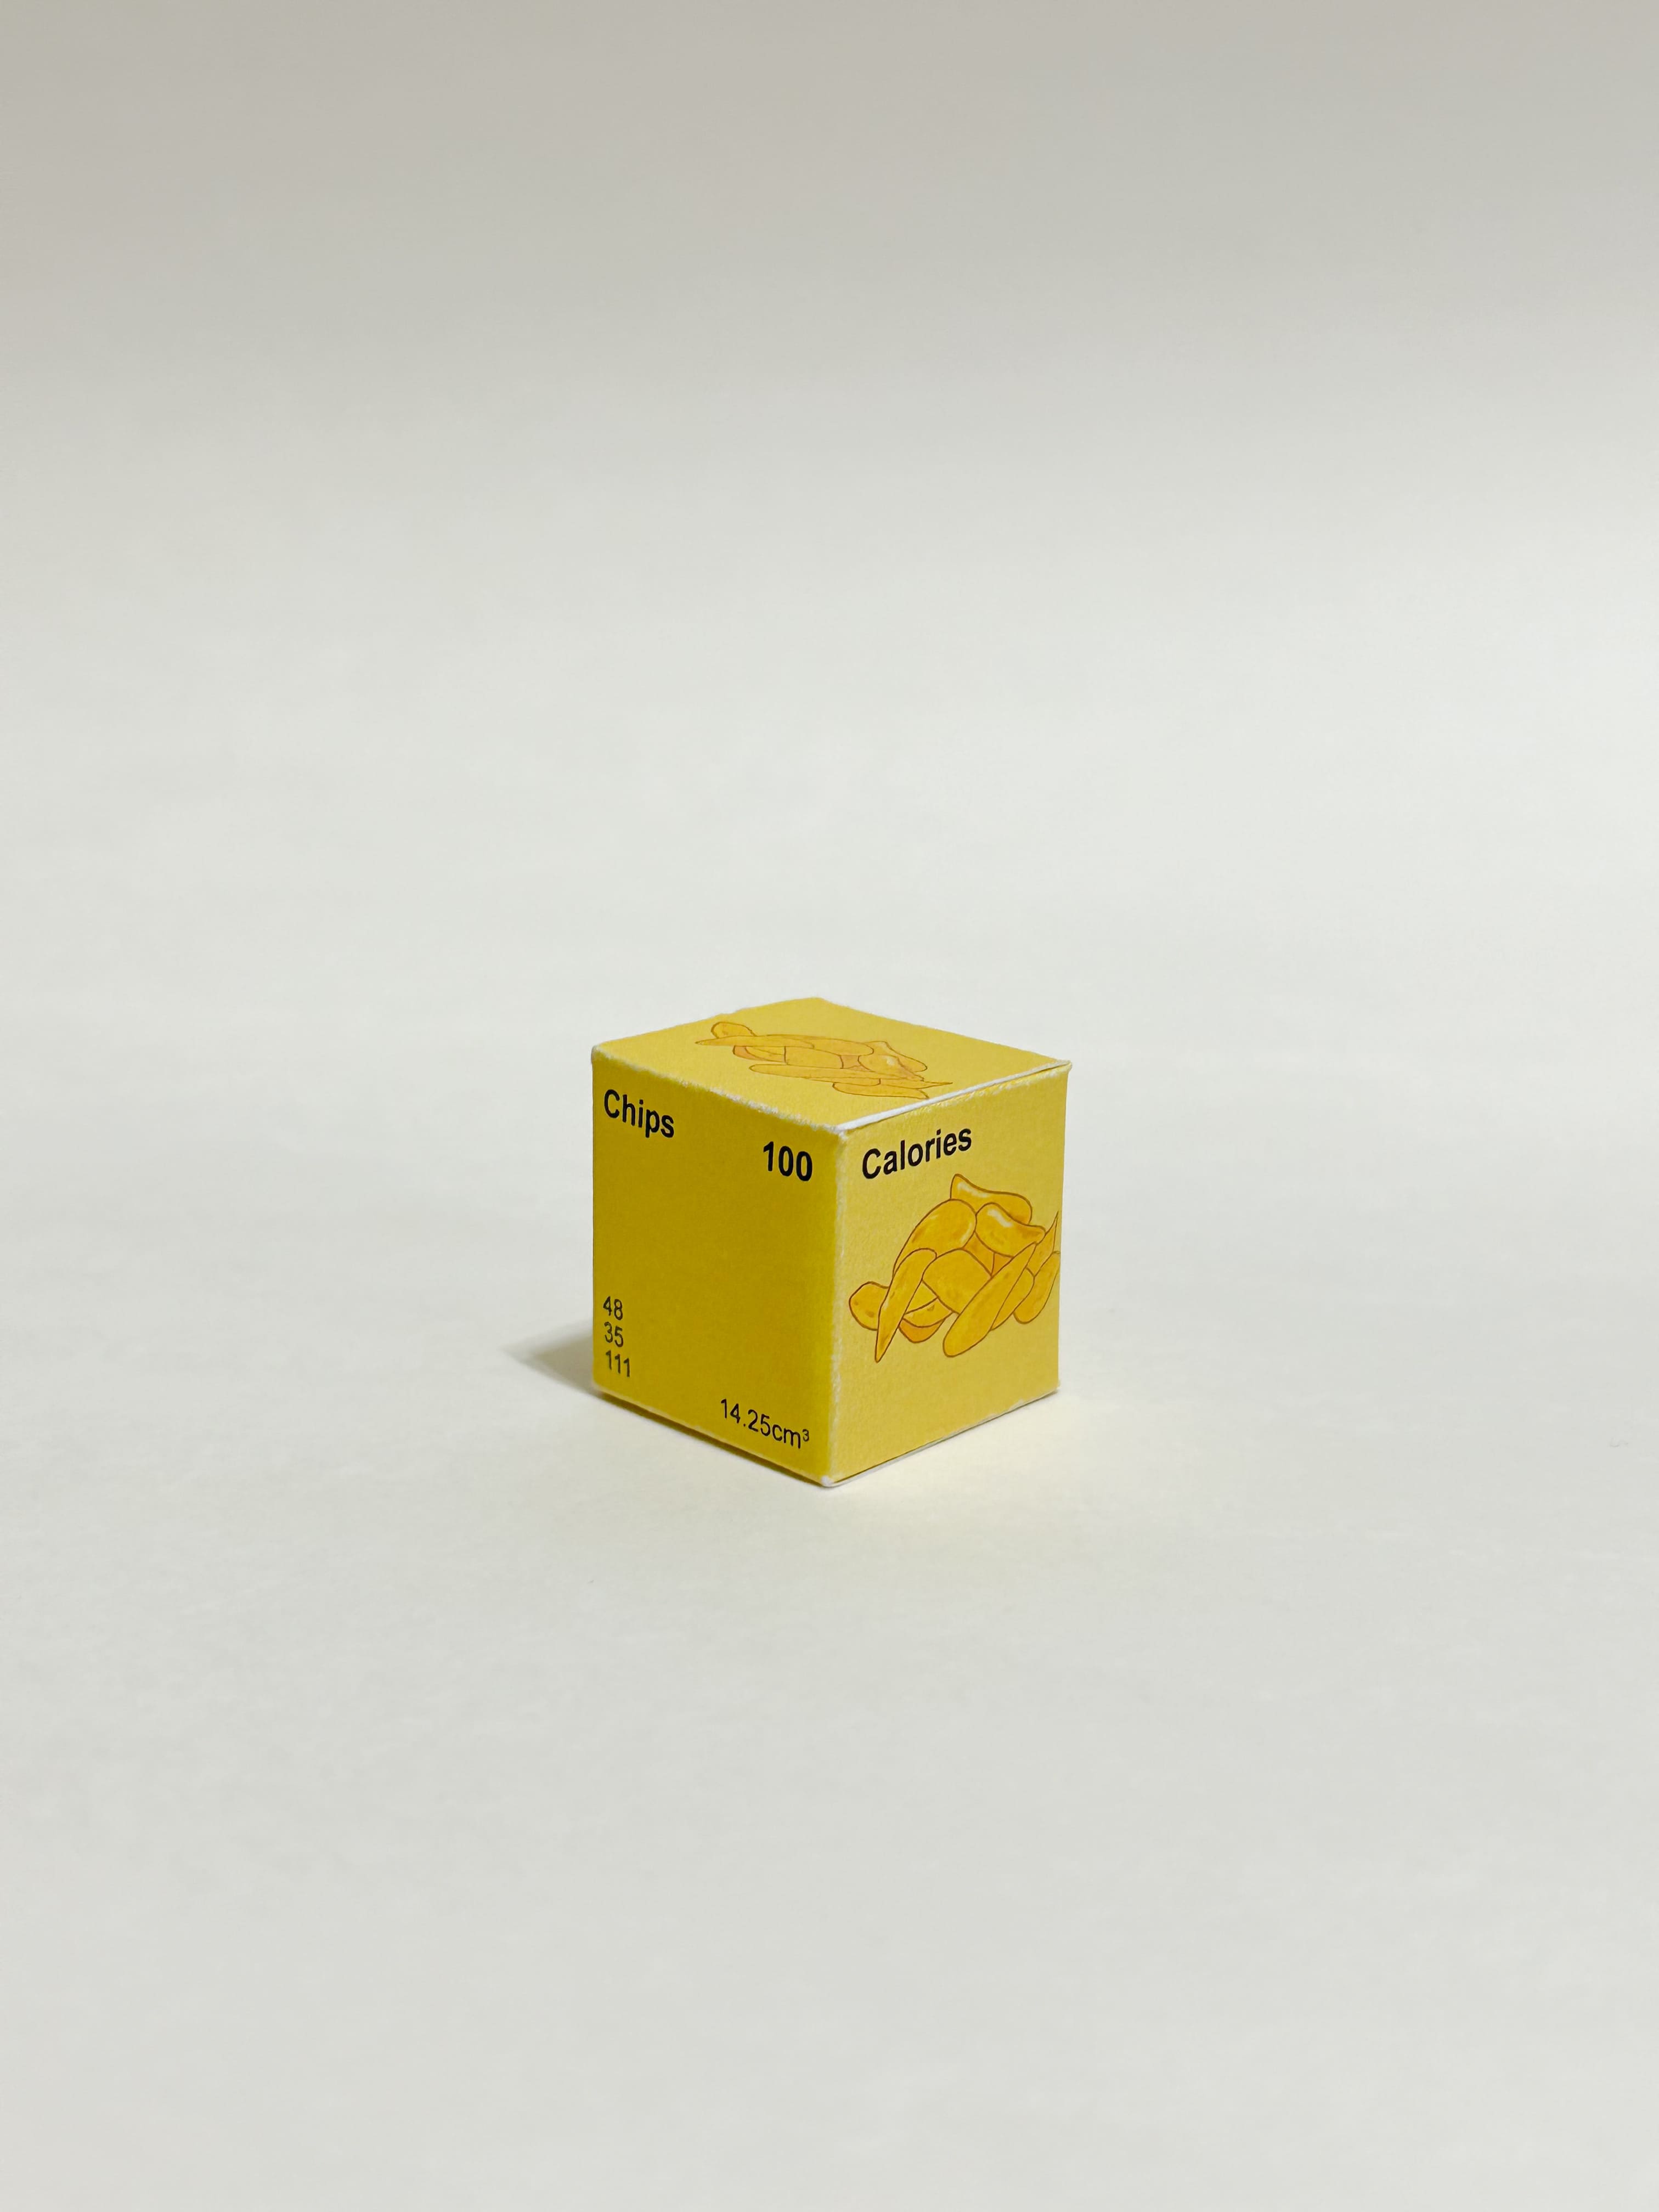
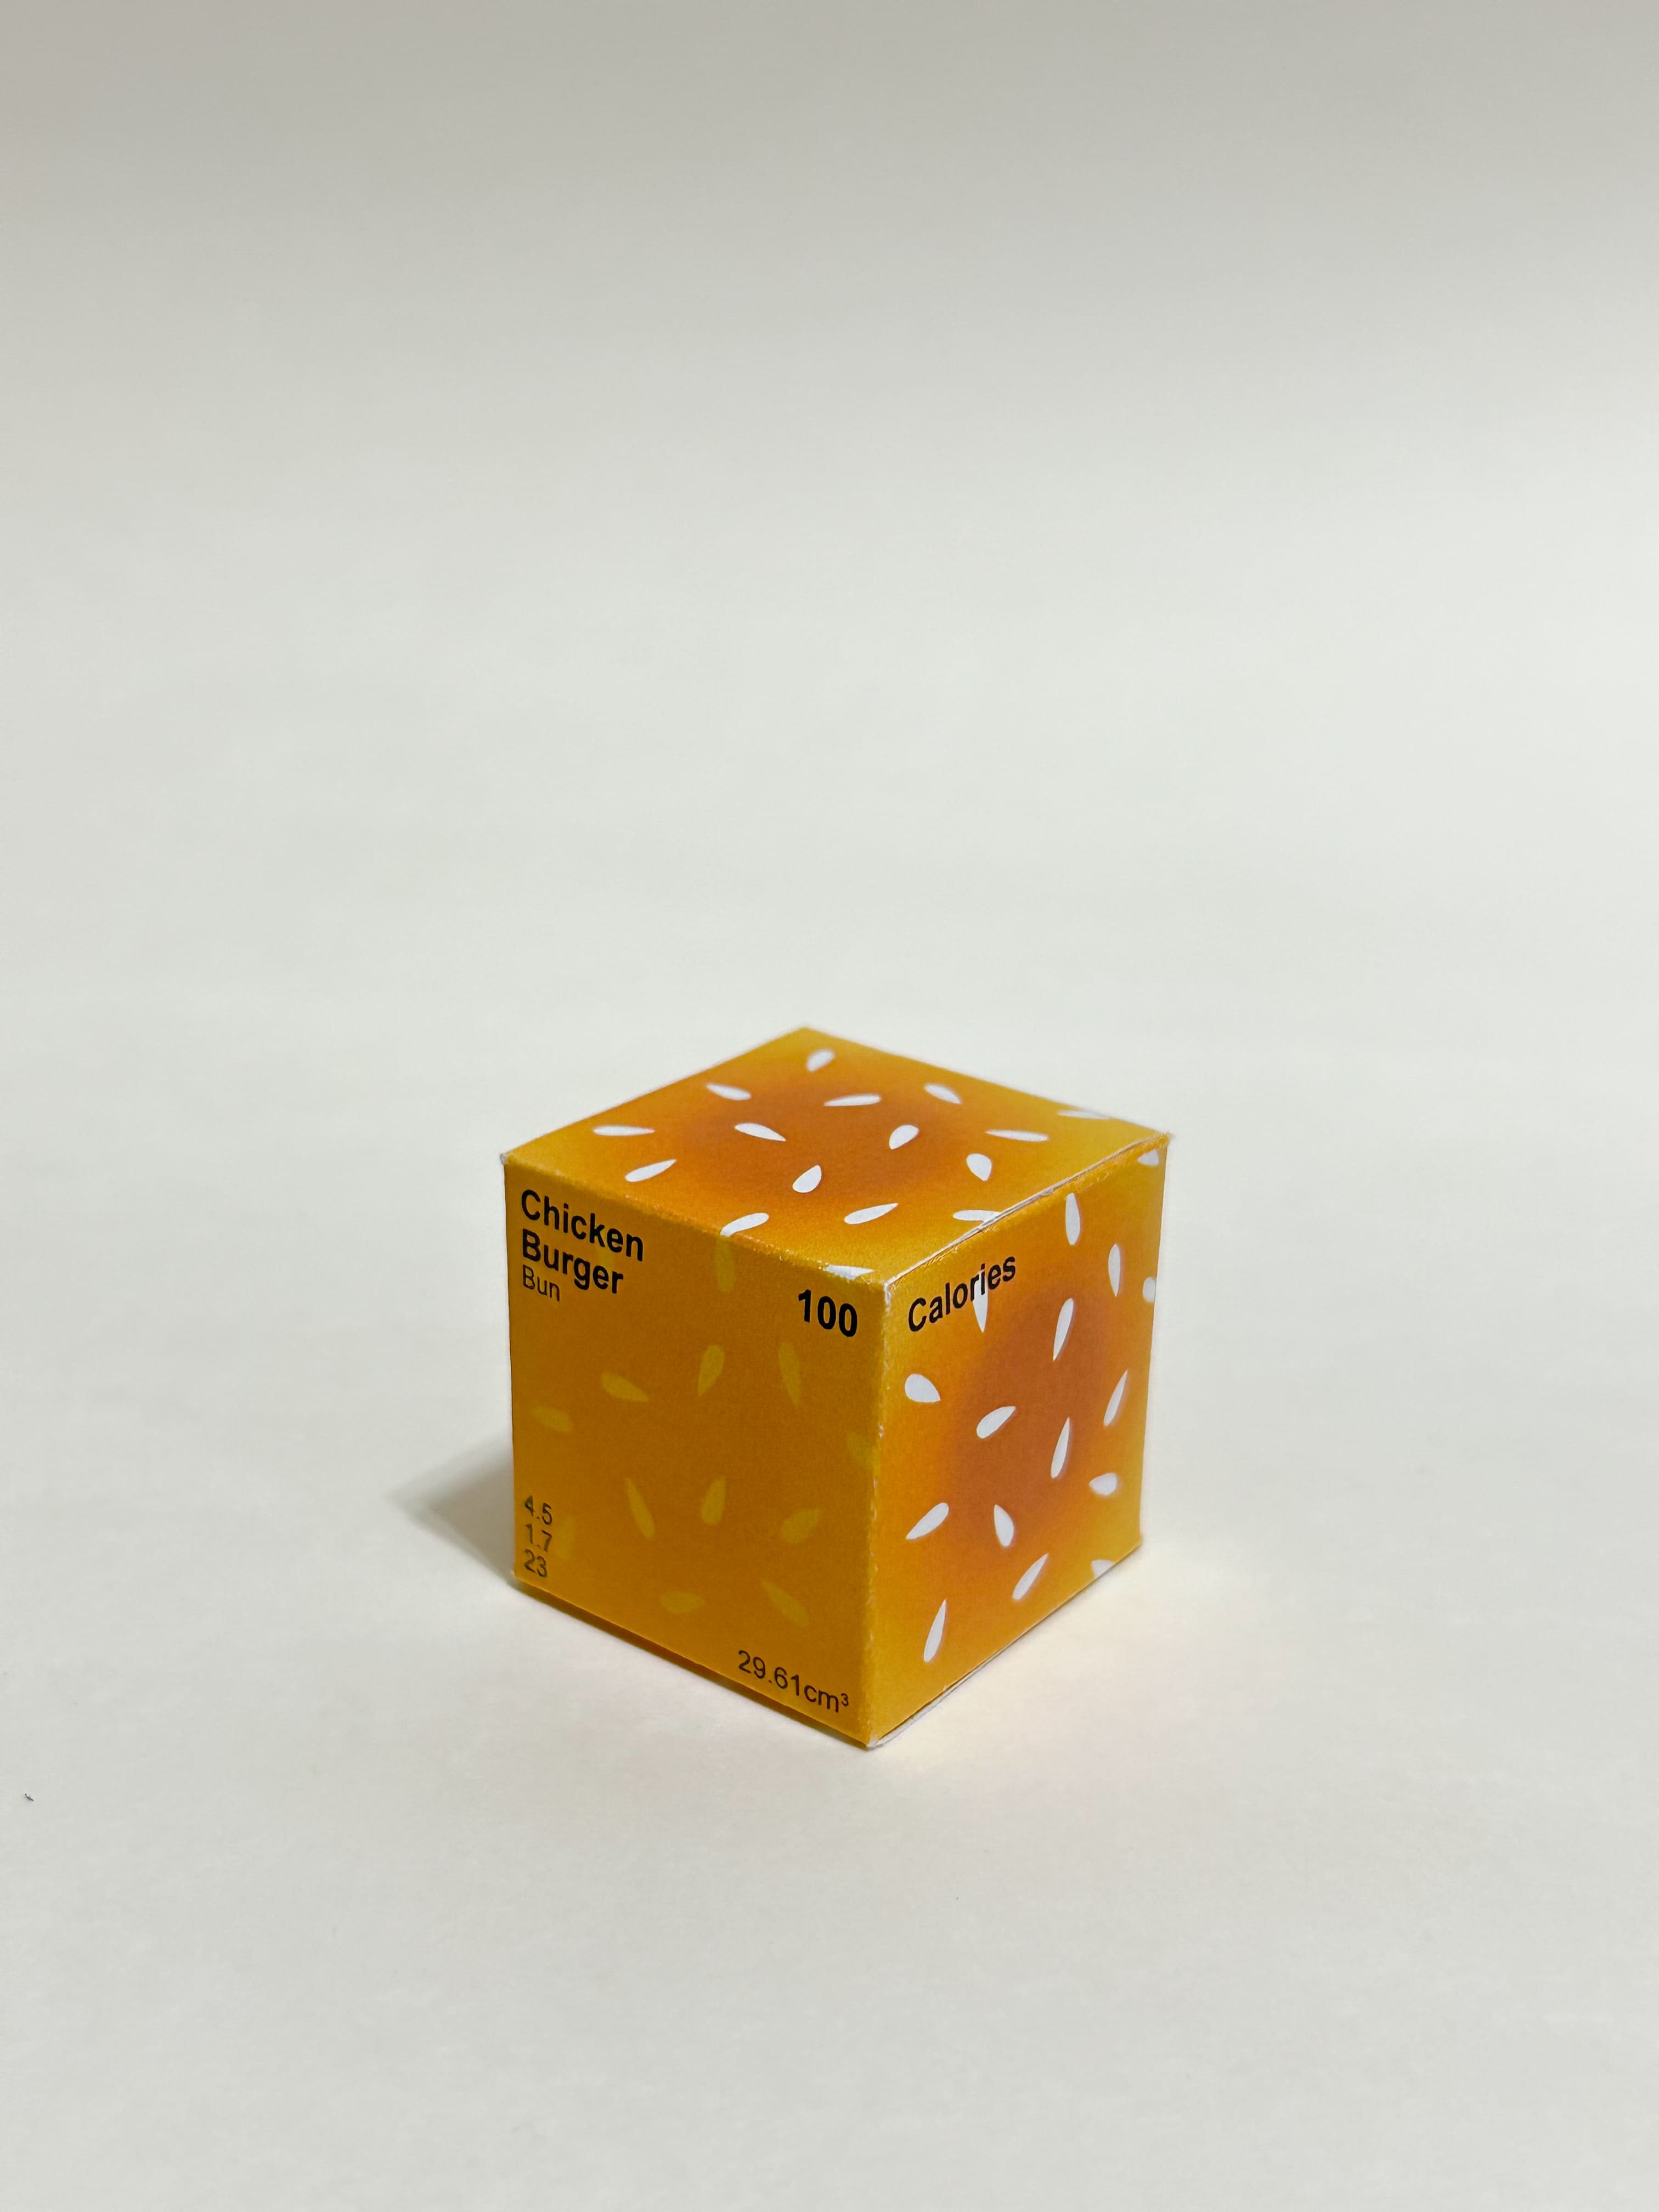
The collected data is then parsed through mathematical formulas to determine the 100 calories of every food items. We first collect the total weight of the ingredients in each food items. With the use of the nutritional information, the formuals calculate the supposed weight of the 'Protein', 'Carbs', and 'Fats' of each ingredients. Water displacement is used to find out the volume which gives us cubic metres(cm3) of all the food ingredients.
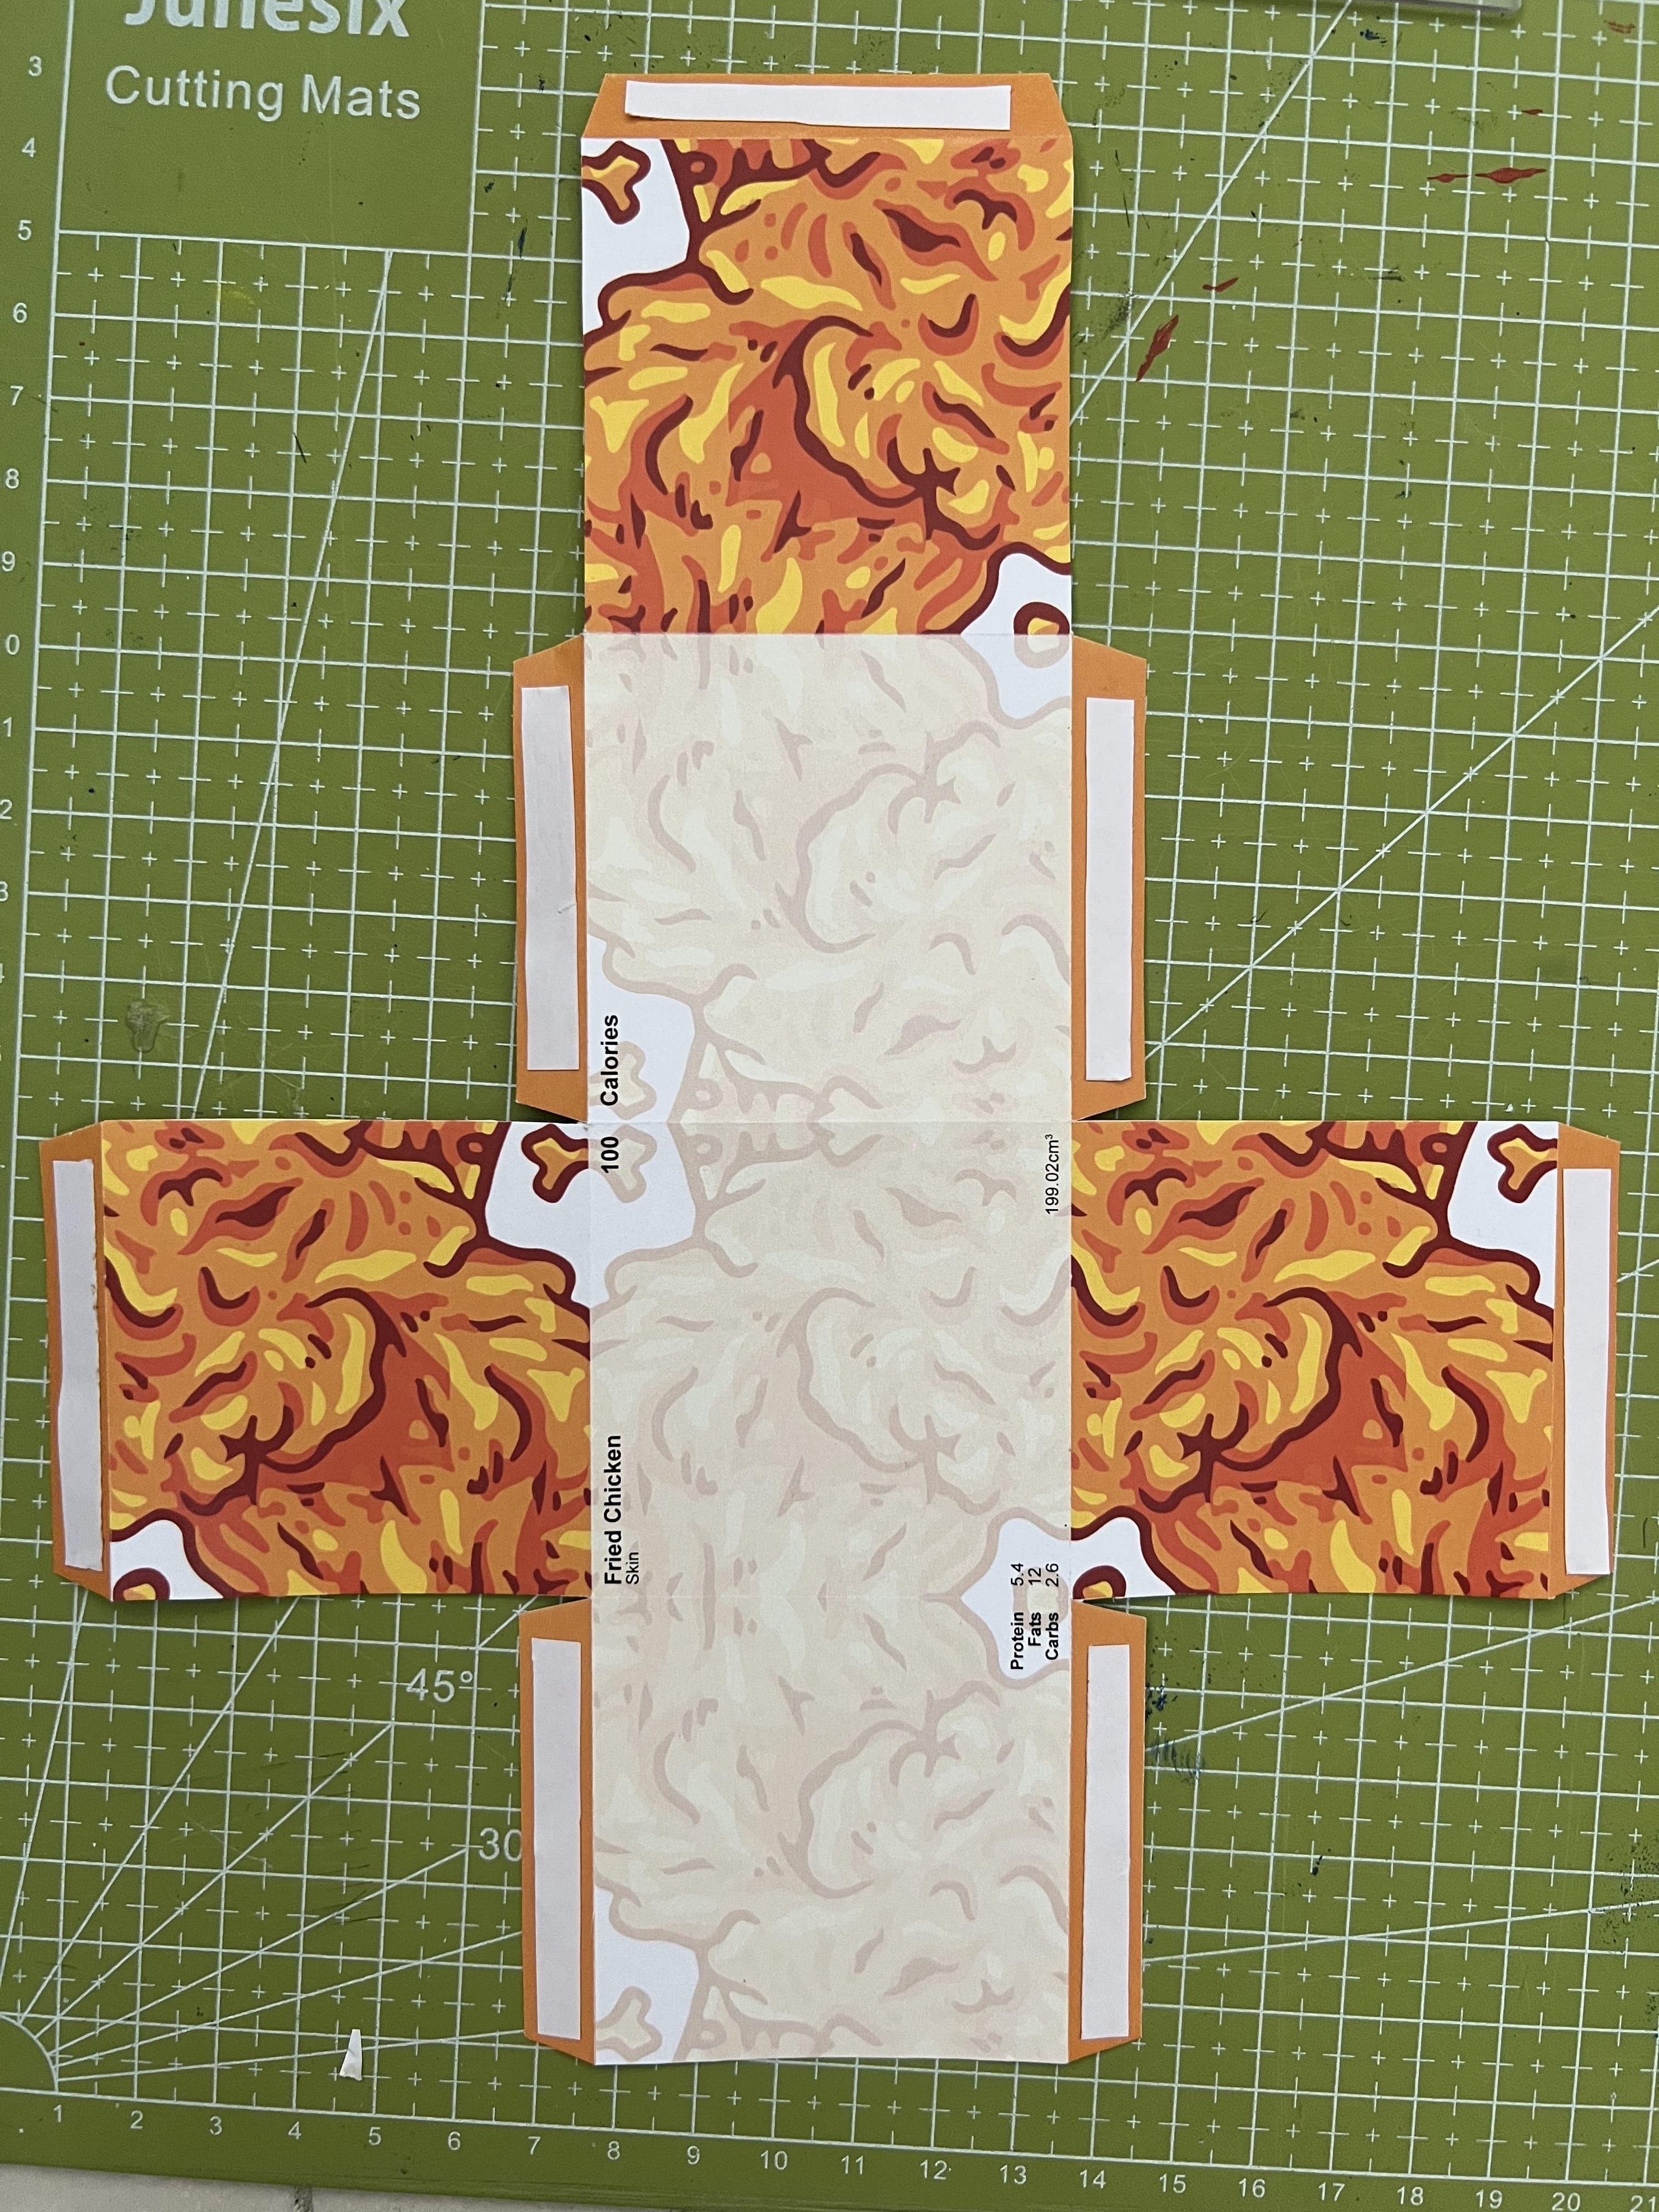
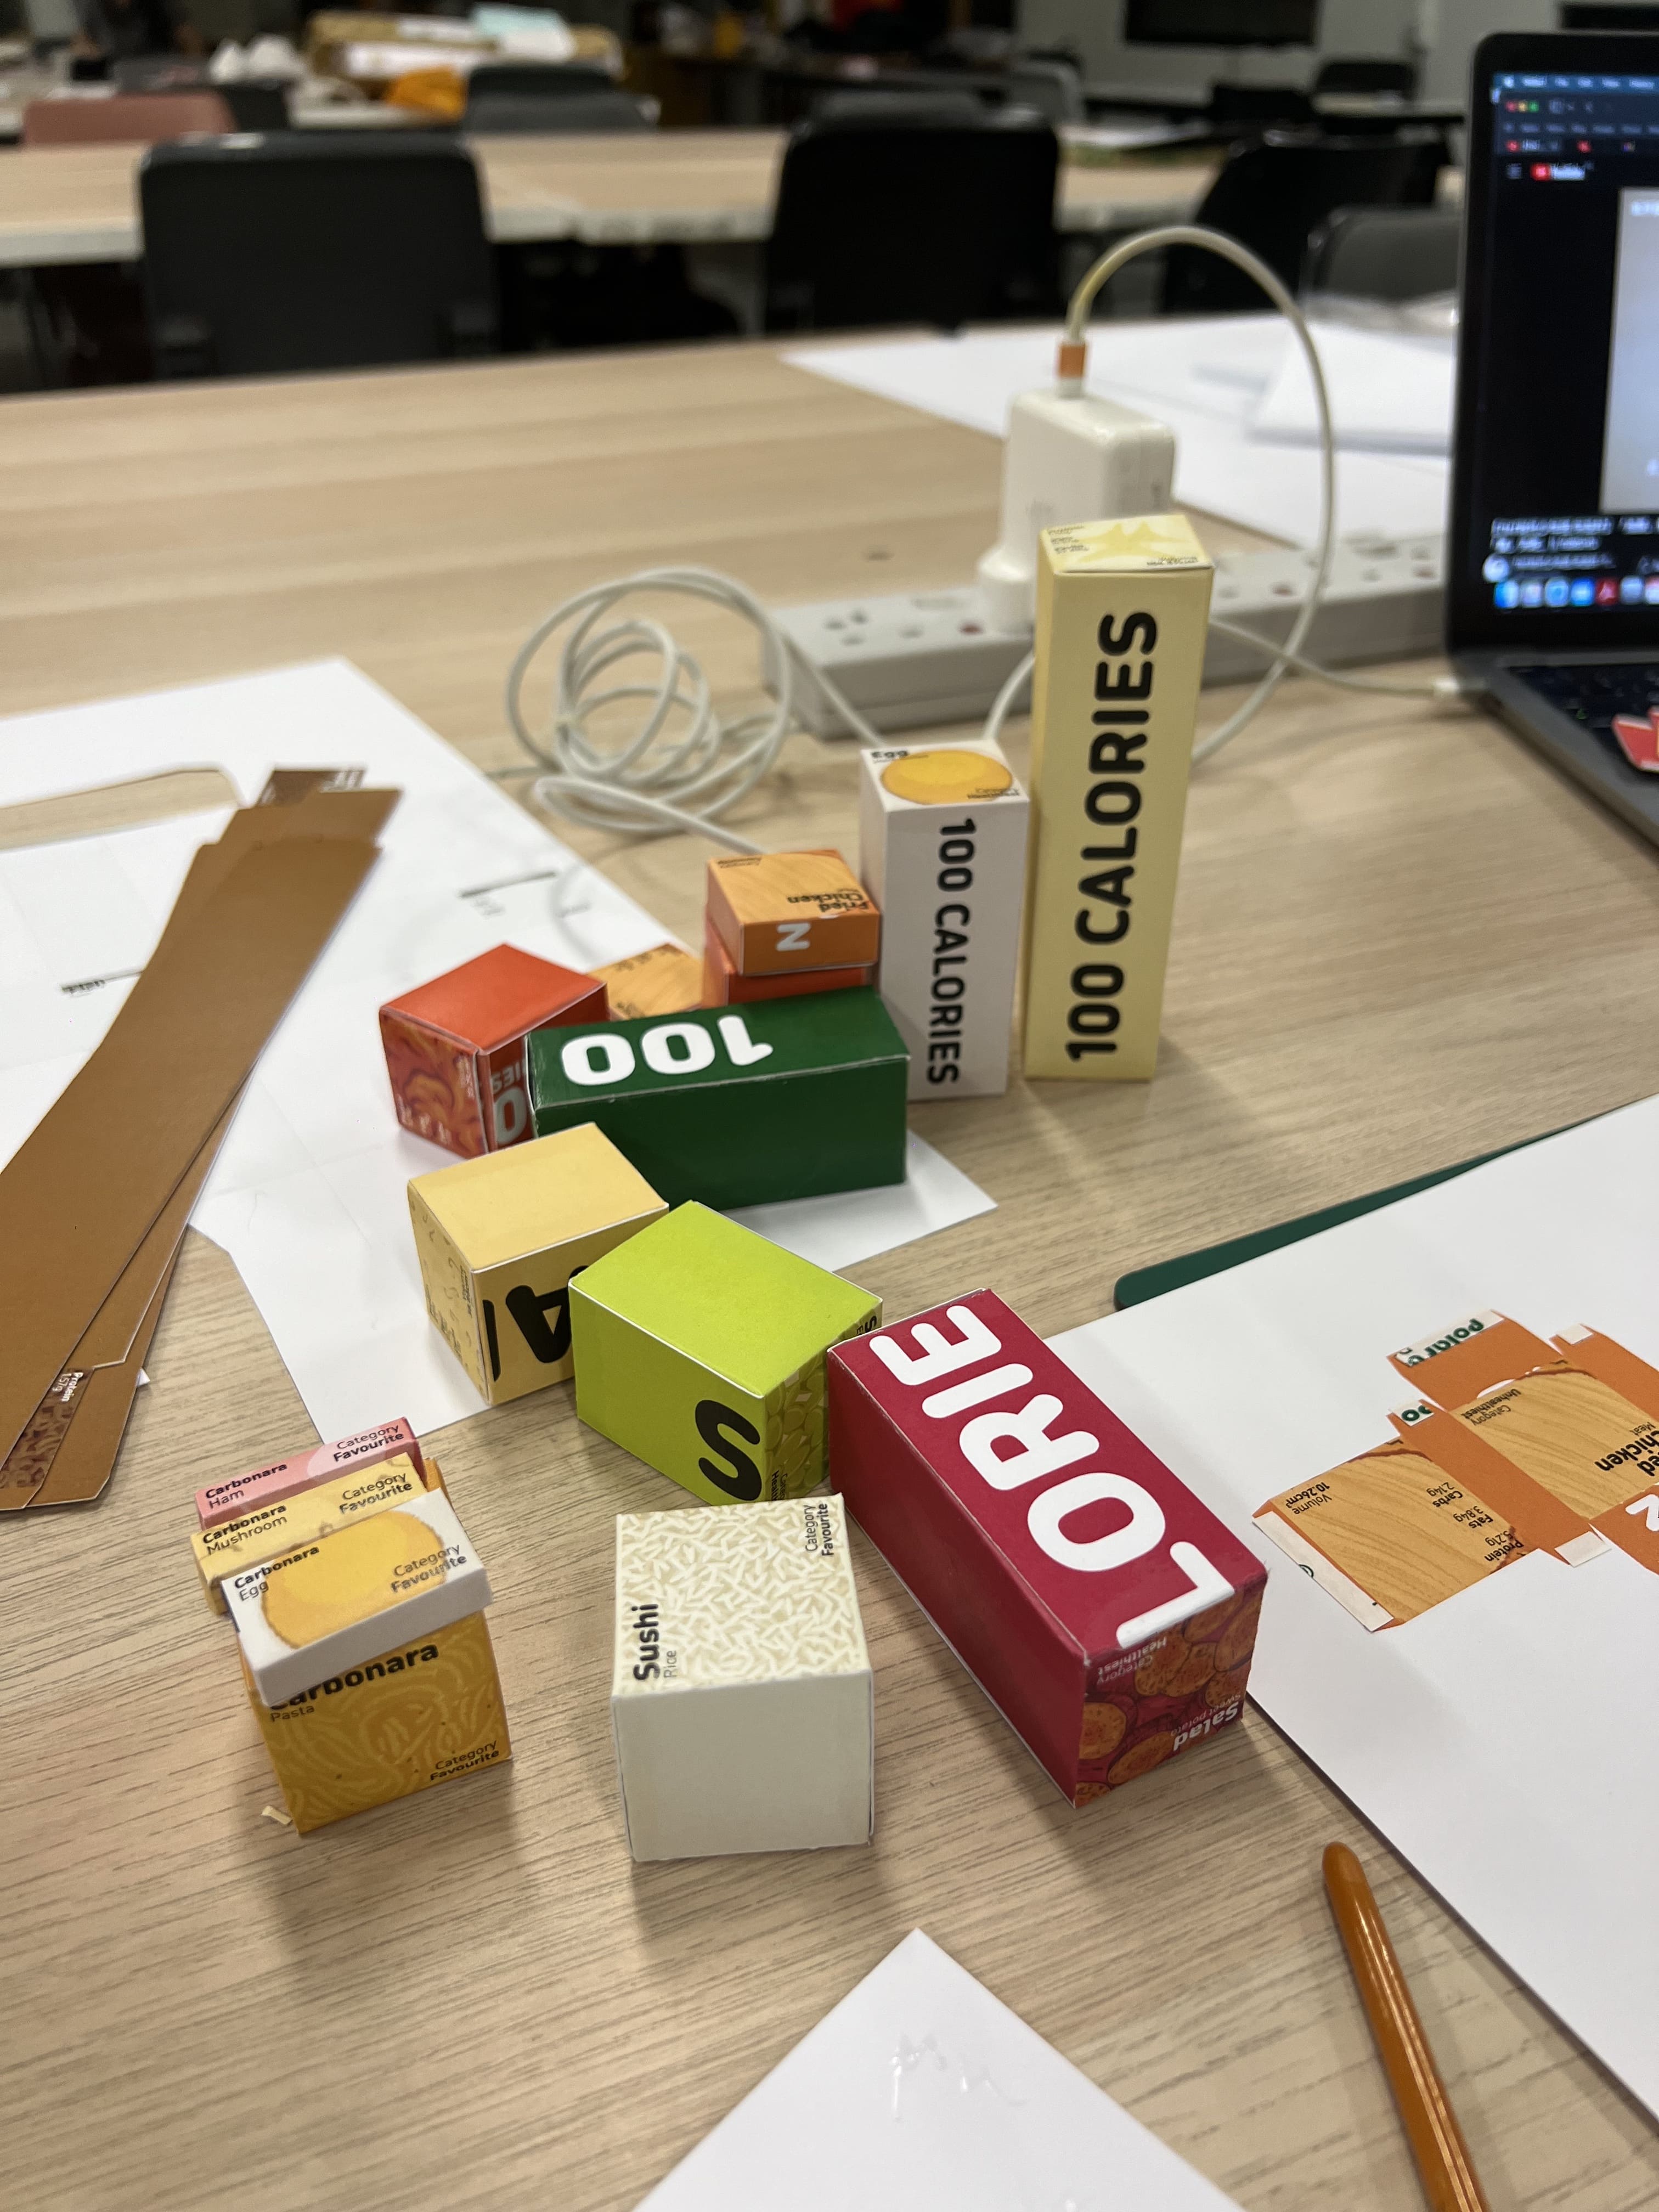
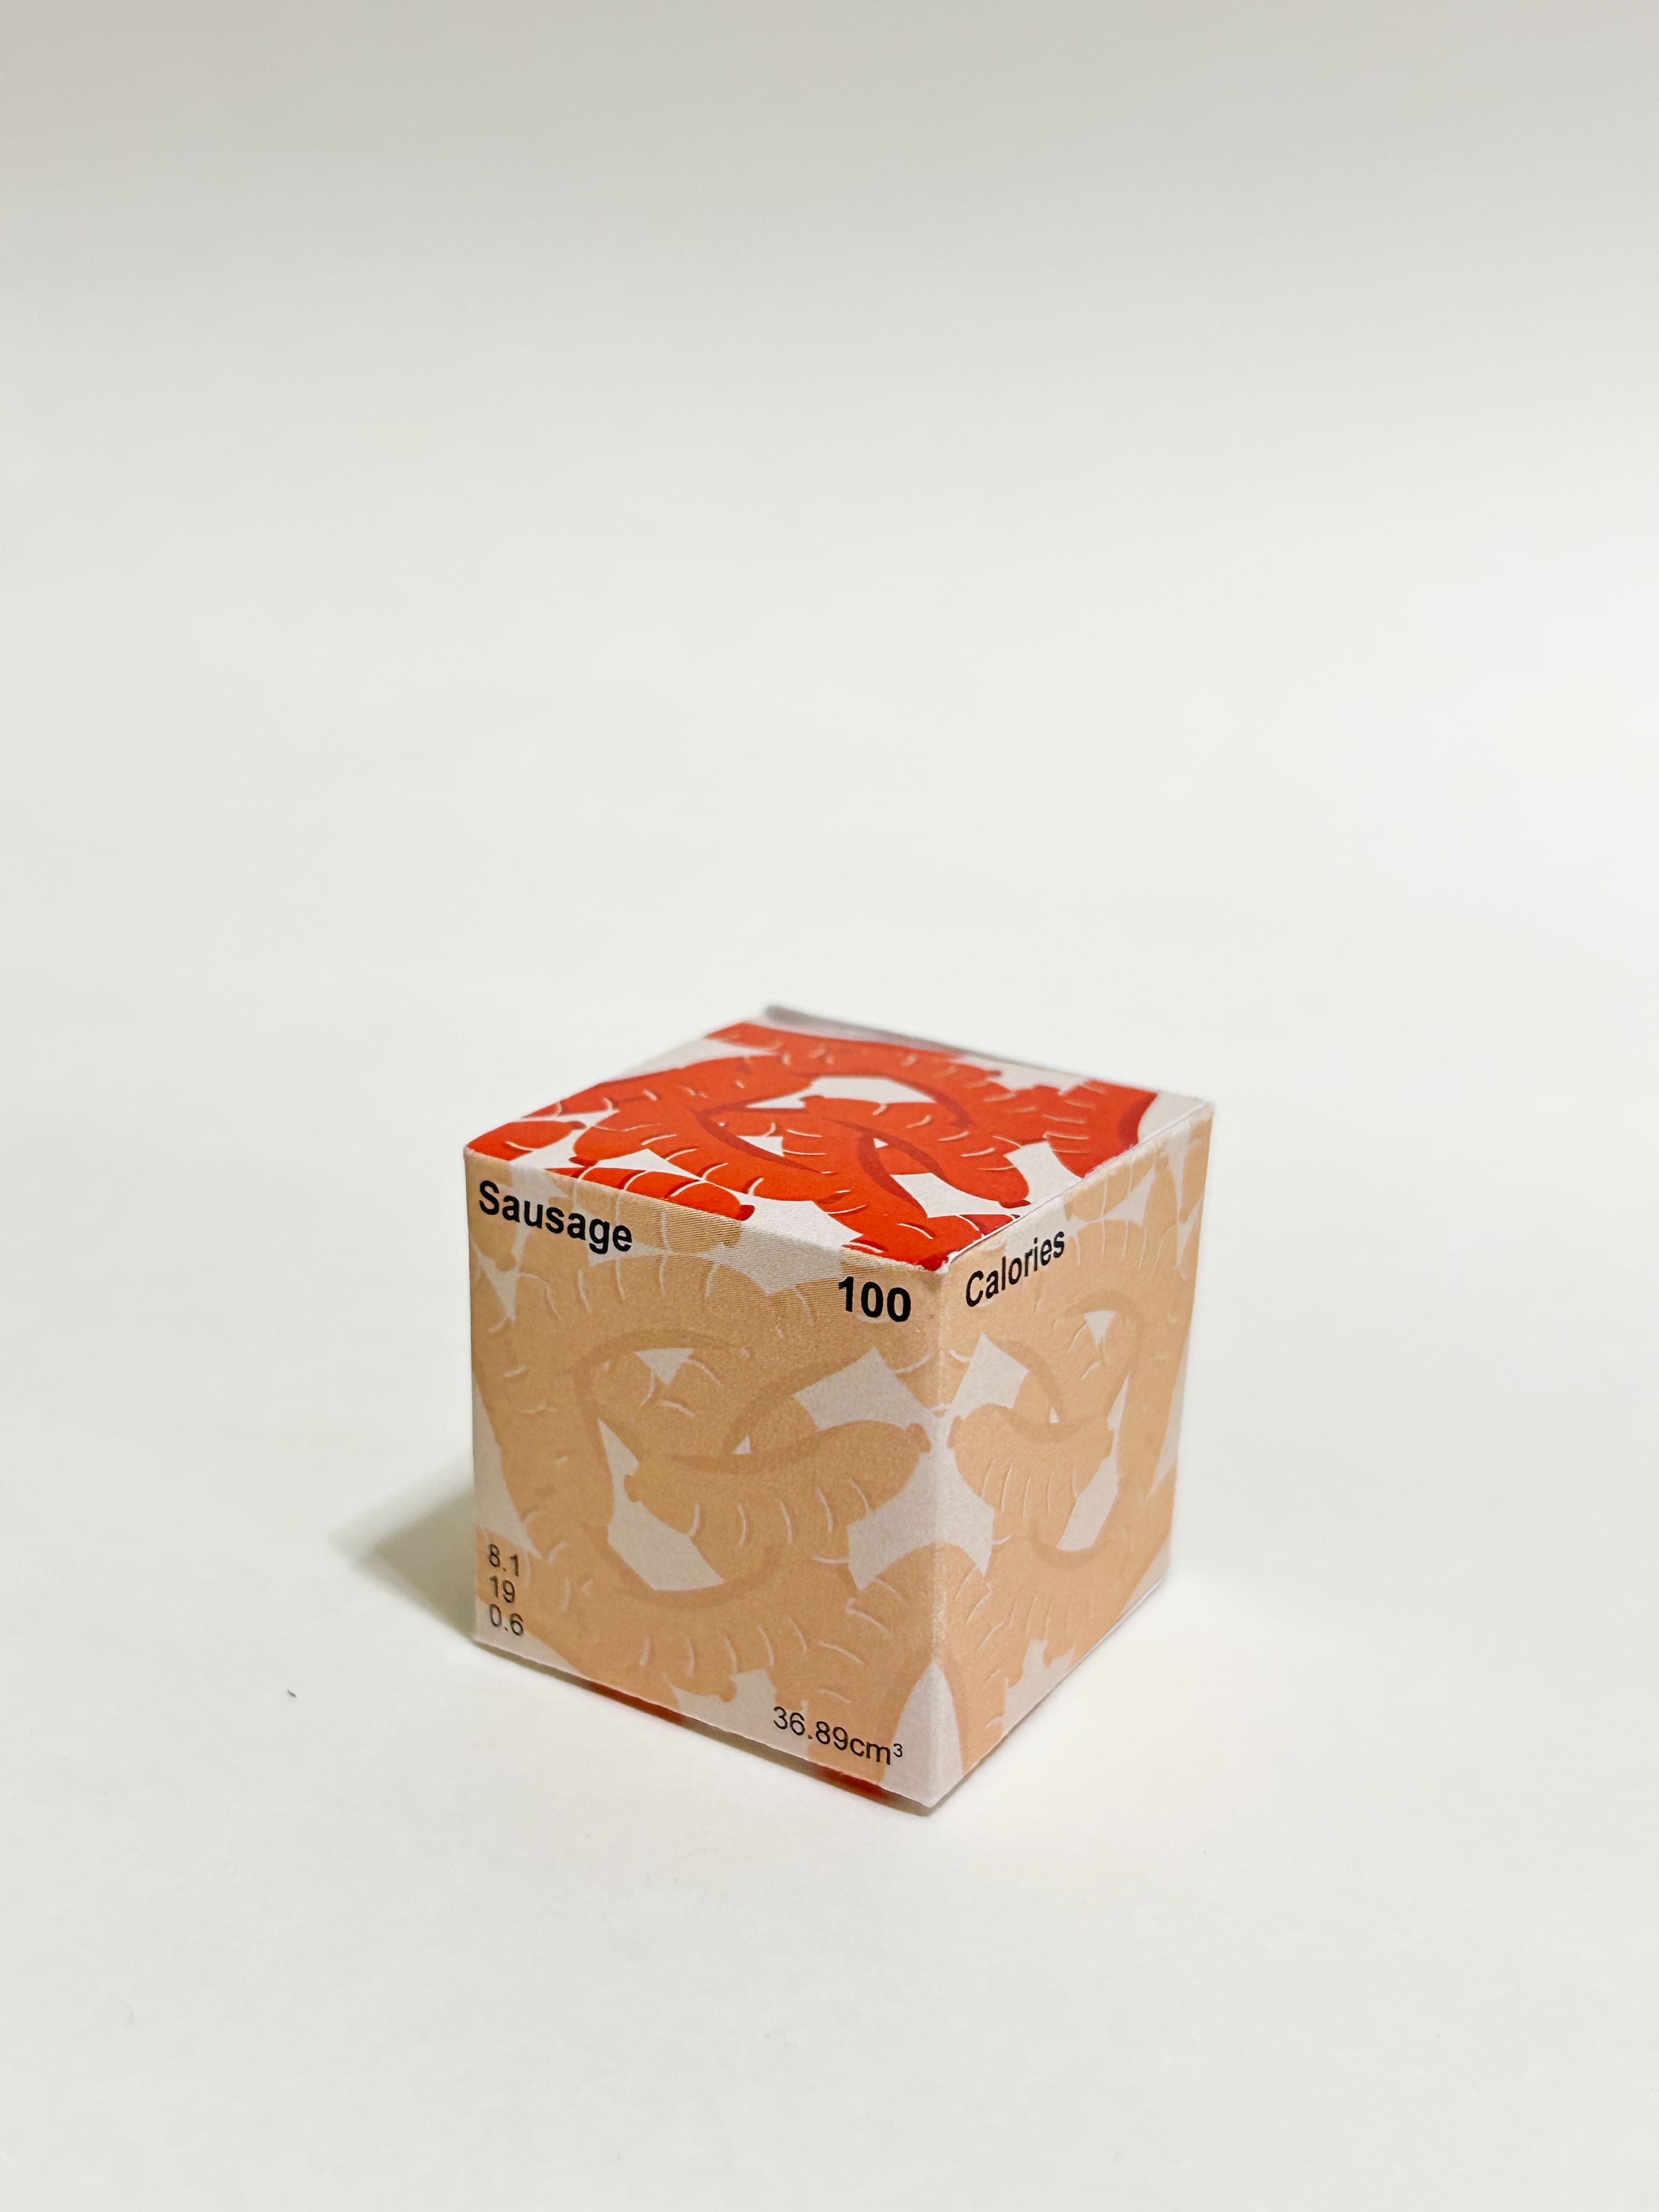
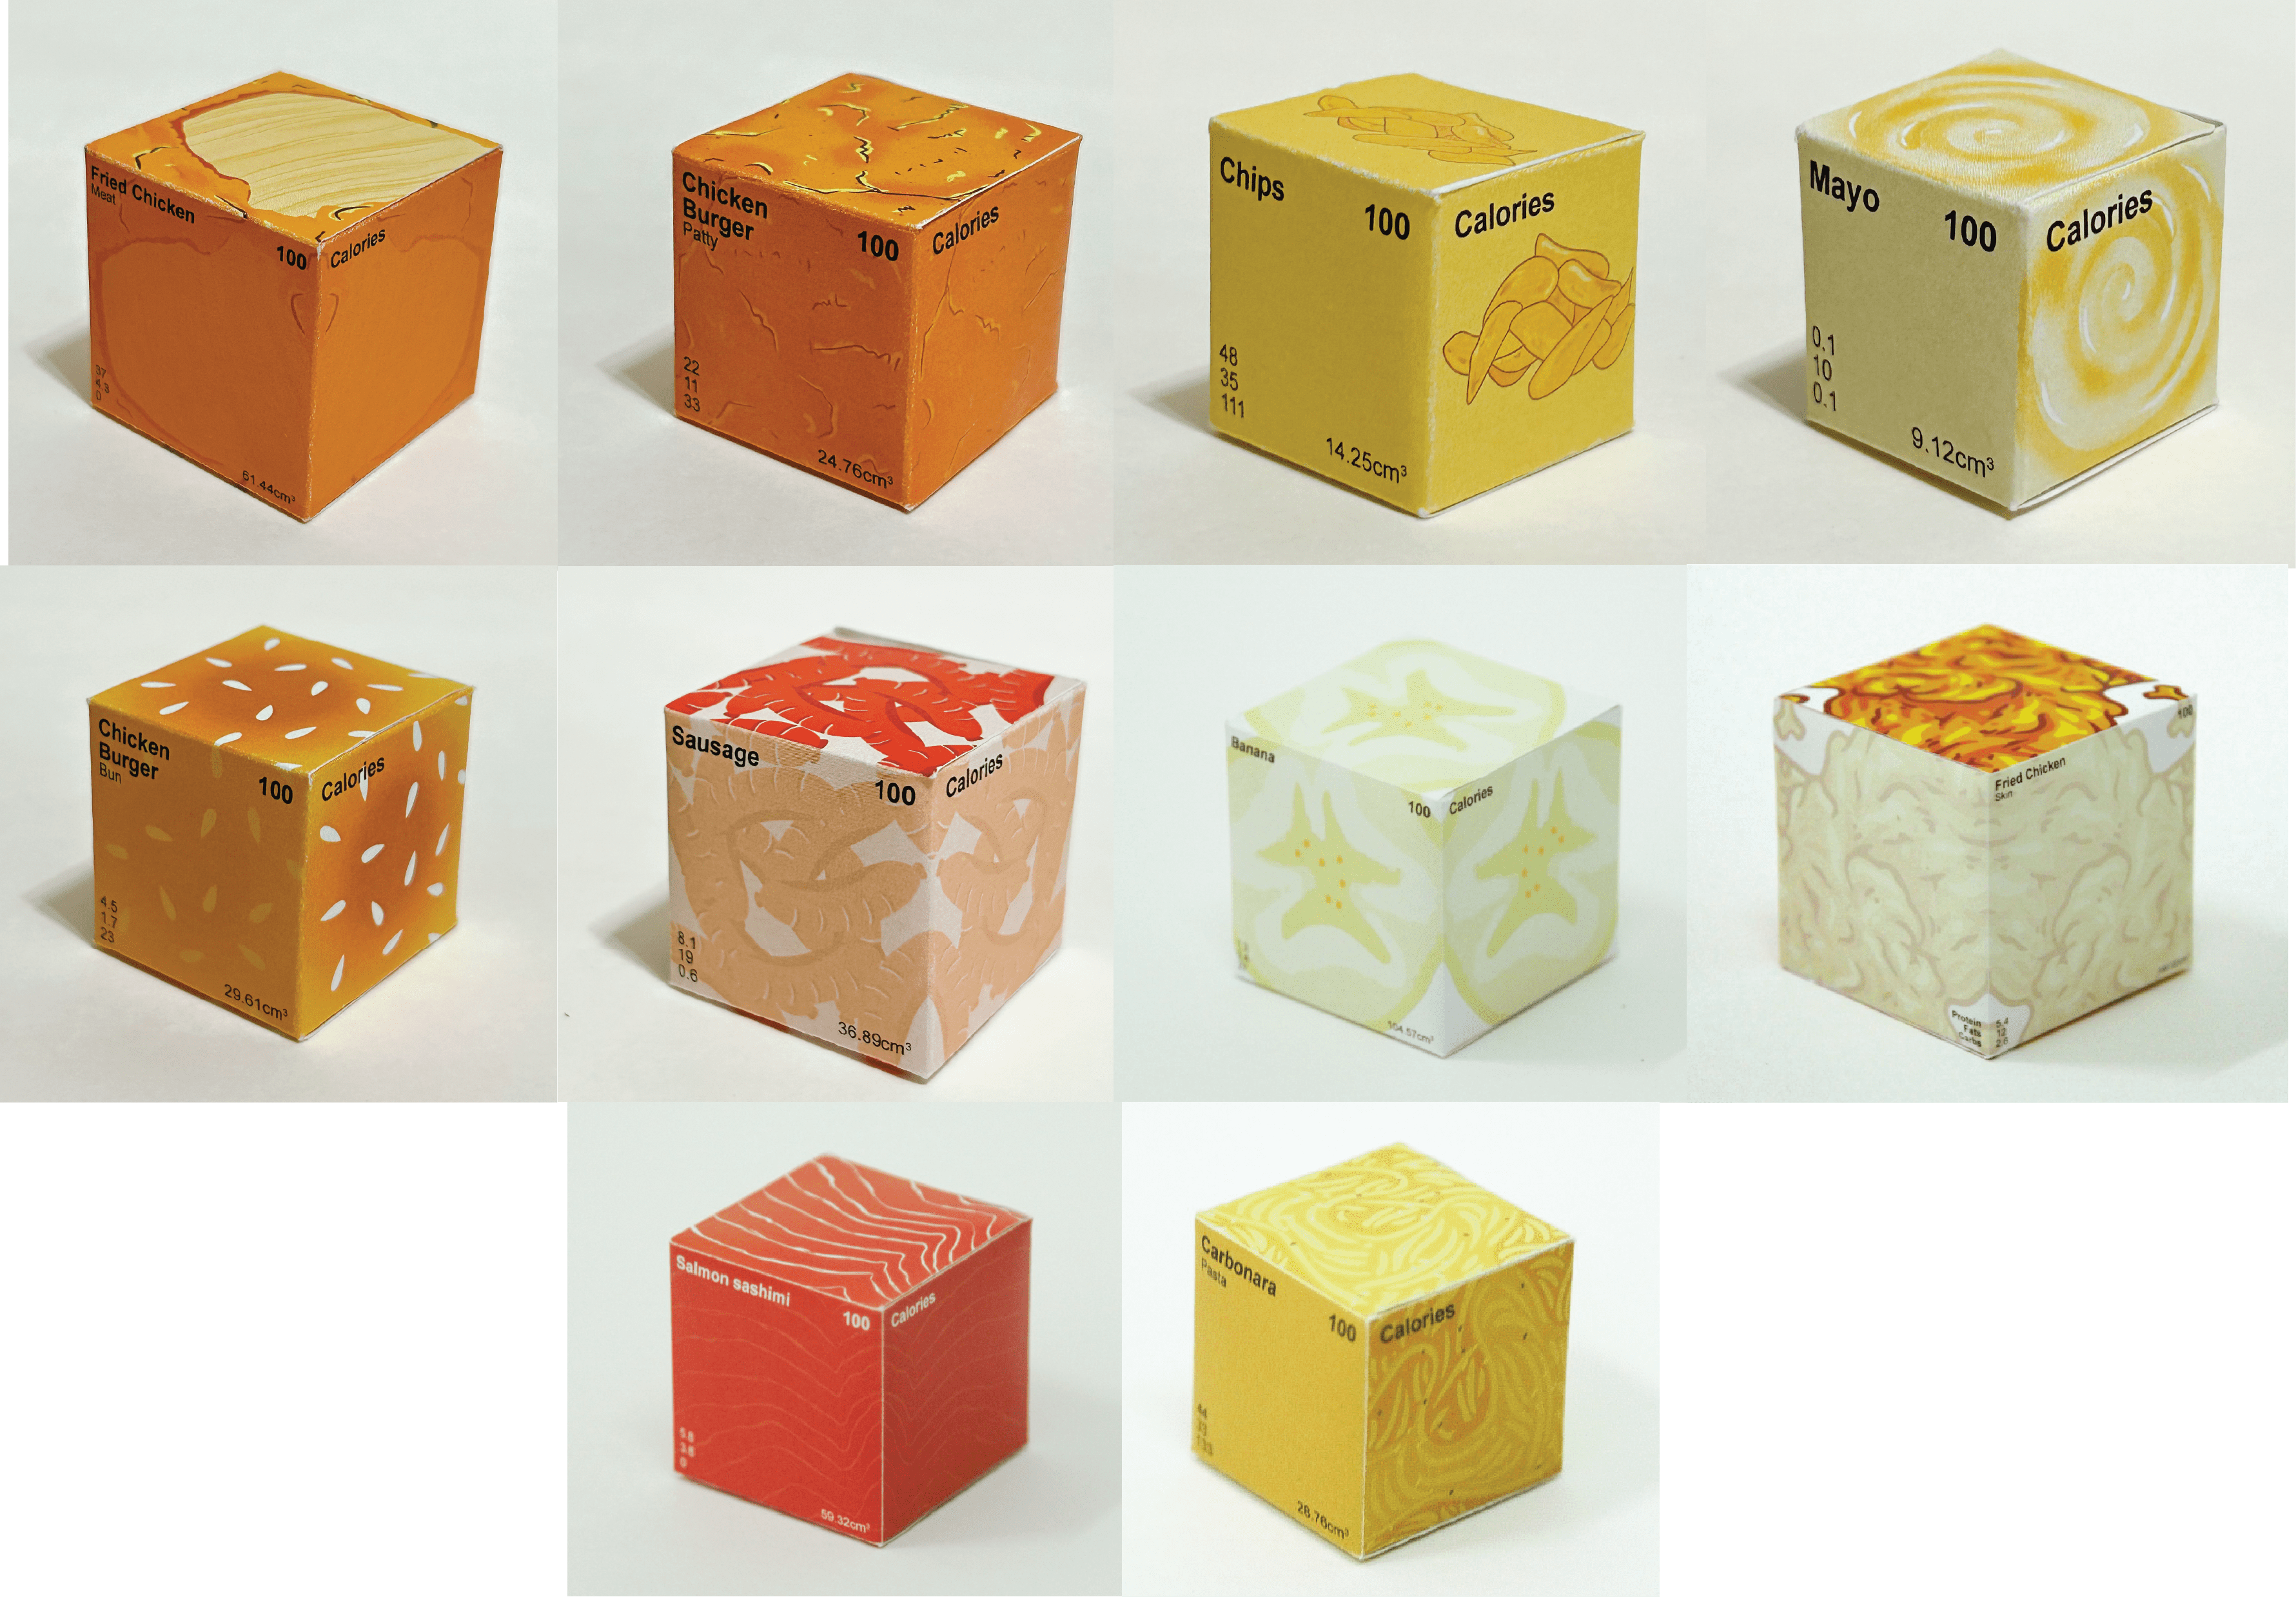
The scale of the physical artefact is determined by the smallest ingredient item. The minimum height is 2mm. We determined that the widest size we can go to keep the length and breath consistent is 30mm x 30mm. '100 calories' is also marked per group item than inidividual ingredient to avoid misconception that each ingredient equates to 100 calories.
Project Background
The large variety of food allows us to assume that they serve more than just simply nutritional value, but also to satisfy our appetite. These two things become contradictory because what often happens is if people want to fulfil their satisfaction with food, the calories intake will exceed the daily need required and nutritional fulfilment will be unbalanced. However, if we focus on meeting health needs, the food we consume won’t satisfy our appetite. In essence, it is difficult to achieve a balance between satisfaction and health.
Based on survey data, we combined the answers of their favourite food, healthiest food, and unhealthiest in 1 meal. Proving that these 3 categories with the right portion composition is possible to run simultaneously to achieve daily calories of 2400 calories and balanced nutrition. The difference in size provides a clear visualisation to compare the portions between the three categories. Through awareness in visualisation, people can make more conscious decisions about what they choose to put into their bodies.
The Objective
In order to make sure that our selection of foods are relatable and grounded in people’s preferences, we decided to determine the food types through a google form survey sampling of our classmate tastes and personal preferences on the type of foods they love, think are unhealthy, and healthy. Through a rating of 1-5 of people’s opinion, we will determine the selection of foods to display for visualisation.
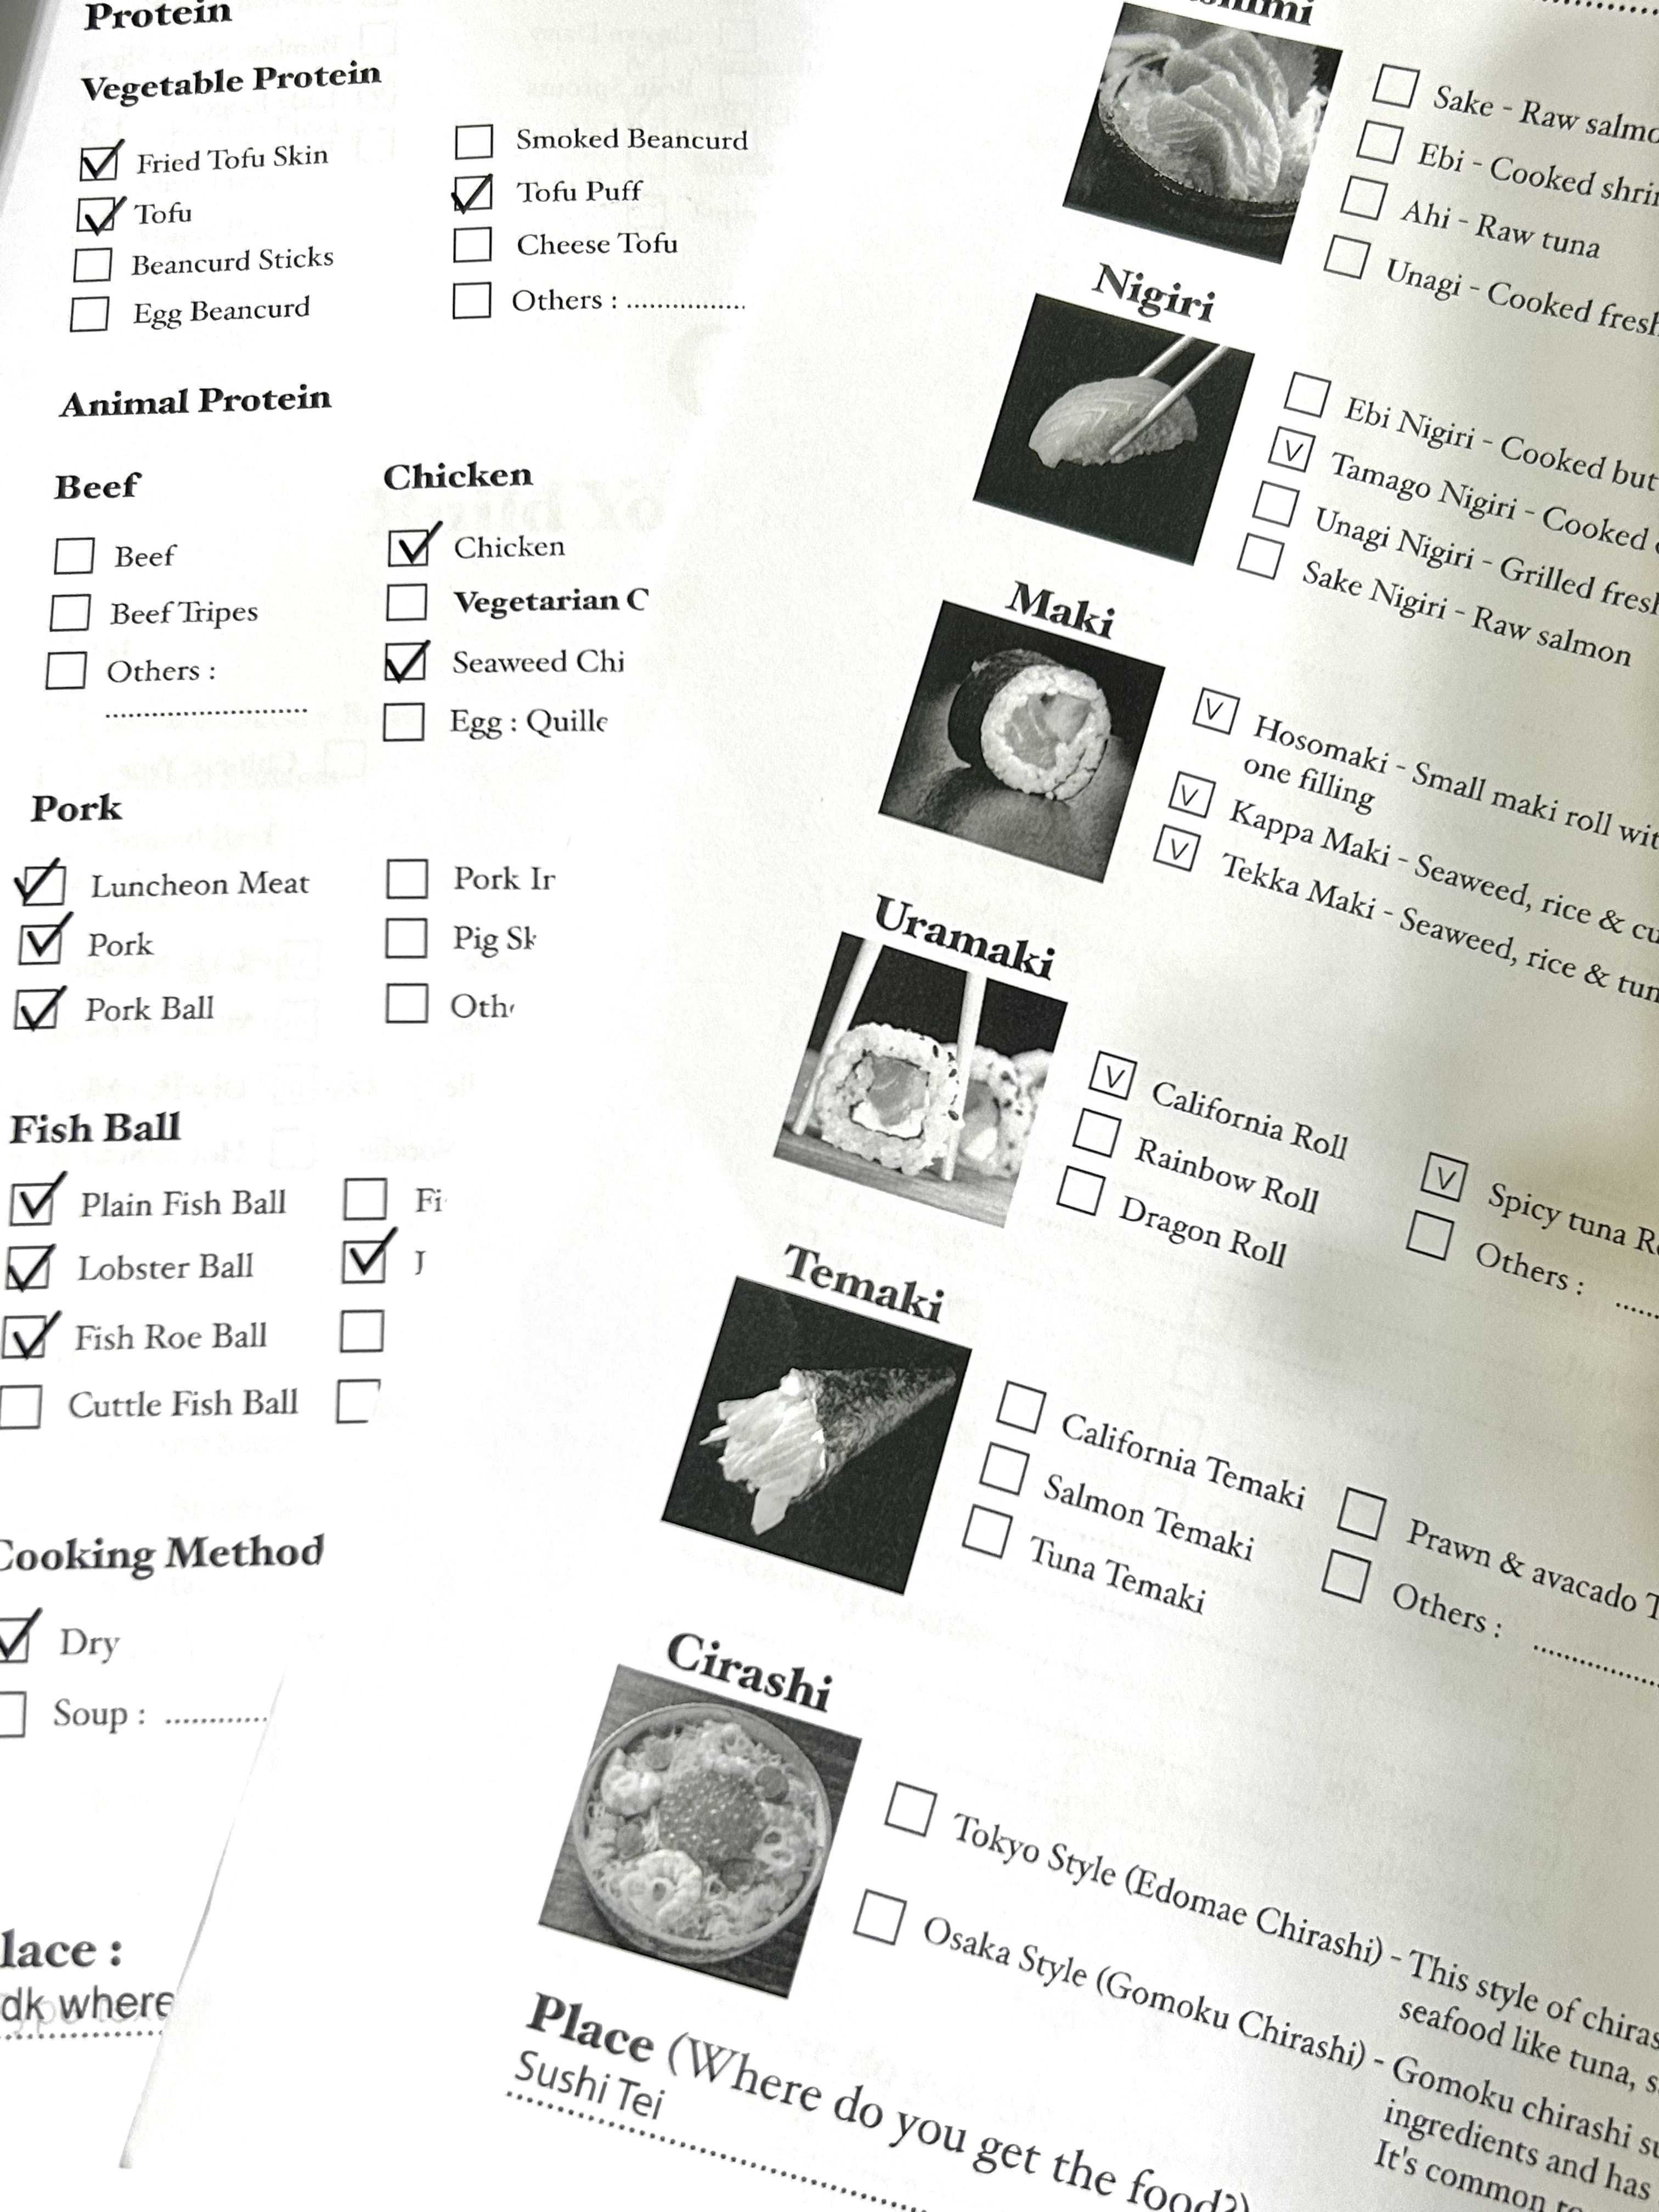
After distributing the survey, we realised that some answers of respondents were varied and not specific enough to give an accurate reading of calories. To get more specific answers, we distributed additional surveys in the form of checkboxes. Answers from the Google Form survey help us determine what types of food should include a checkbox. After completing the survey with checkboxes we get specific food answers which make it easier for us to determine the ingredient types of general food groups.
Our Approach
After determining the food types in each category, we need to gather the data through the use of measuring tools like weighing scale and measuring beaker. We bought all the recorded food items for each categories to separate, and weigh the individual ingredients for each food type. The purpose of this is to collect data in the ratio of ingredients present in the food. Using water displacement technique, we placed the food ingredients into the measuring beaker to record down the volume shown.
Data collected
From 20 respondents' answers to the survey, we selected the most popular answers from each category and obtained the following data :
1) Favourite food : Tamago nigiri, Mala (pork, fried tofu skin, cheese tofu, enoki mushroom, oyster mushroom), Spaghetti carbonara, Fried chicken.
2)Healthy food : Salad, Vegetables, Fish, Banana, Hard boiled egg.
3)Unhealthy Food: Instant noodle, Fried chicken, Potato chips, McD chicken burger, Sausages
“Data is like garbage. You’d better know what you are going to do with it before you collect it” - Mark Twain
Artefact
This artefact is an innovative, interactive, and educational way that can increase the effectiveness of showcasing health catering menus. Instead of having the real food in plastic windows or just showing a physical menu with lots of words and numbers, this can be an additional tool to give a better visualisation of the meal portion. The artefact allows the customers to compare and juxtaposed the composition of food from three different categories (favourite, healthy, and unhealthy) sharing in a portion of meal. With this artefact, we can help customers achieve their goals in participating the health catering, namely getting combinations of food that still fulfils the appetite but also with balanced calories and nutritions as well as the education about calories and nutrition.
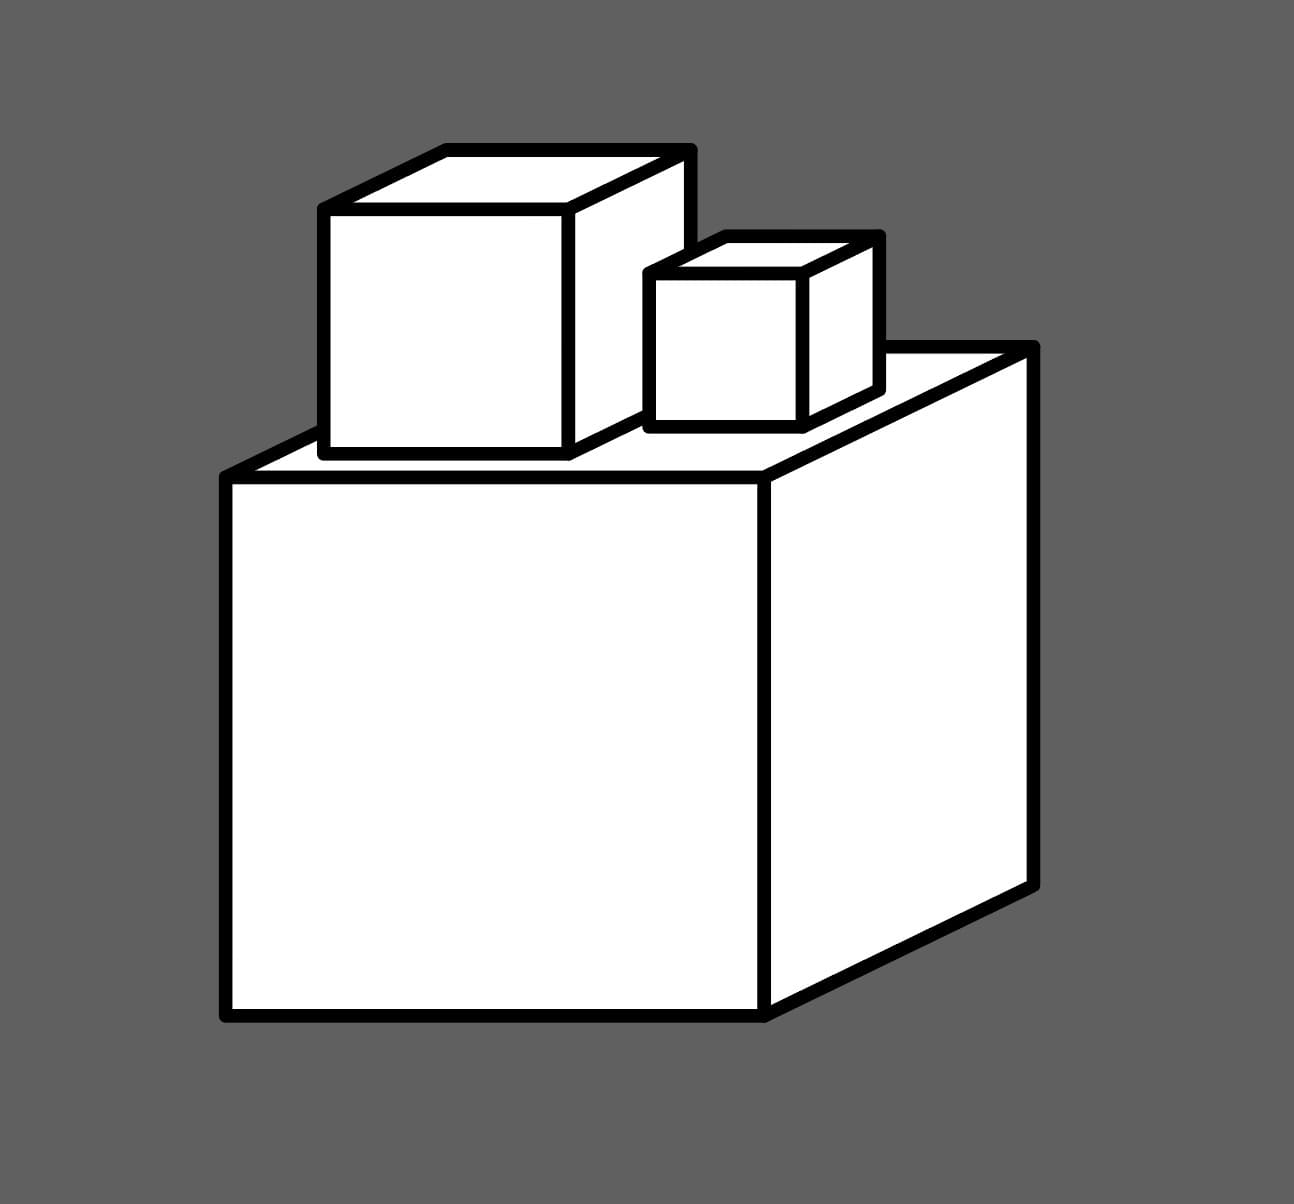
On average, the body needs 2400 calories a day, which means 1 meal needs 800 calories because humans normally eat 3 times a day. A large container represents 800 calories and the food in it, with different portion sizes, if added up will reach 800 calories. On each food component we provided nutritional information so people can find out the nutrition of each food component they will eat. The food contained in the box can be substituted by other food and some components from the food stack can be removed when not wanted. In this way, customers know that there are many combinations of possibilities to eat deliciously without neglecting health.
“Within the intricate folds of a physical artifact lies the profound story of 100 calories, a tangible narrative crafted from paper and passion. There is no words or numbers that work as useful as artifacts” - The Abstract of Design
Conclusion
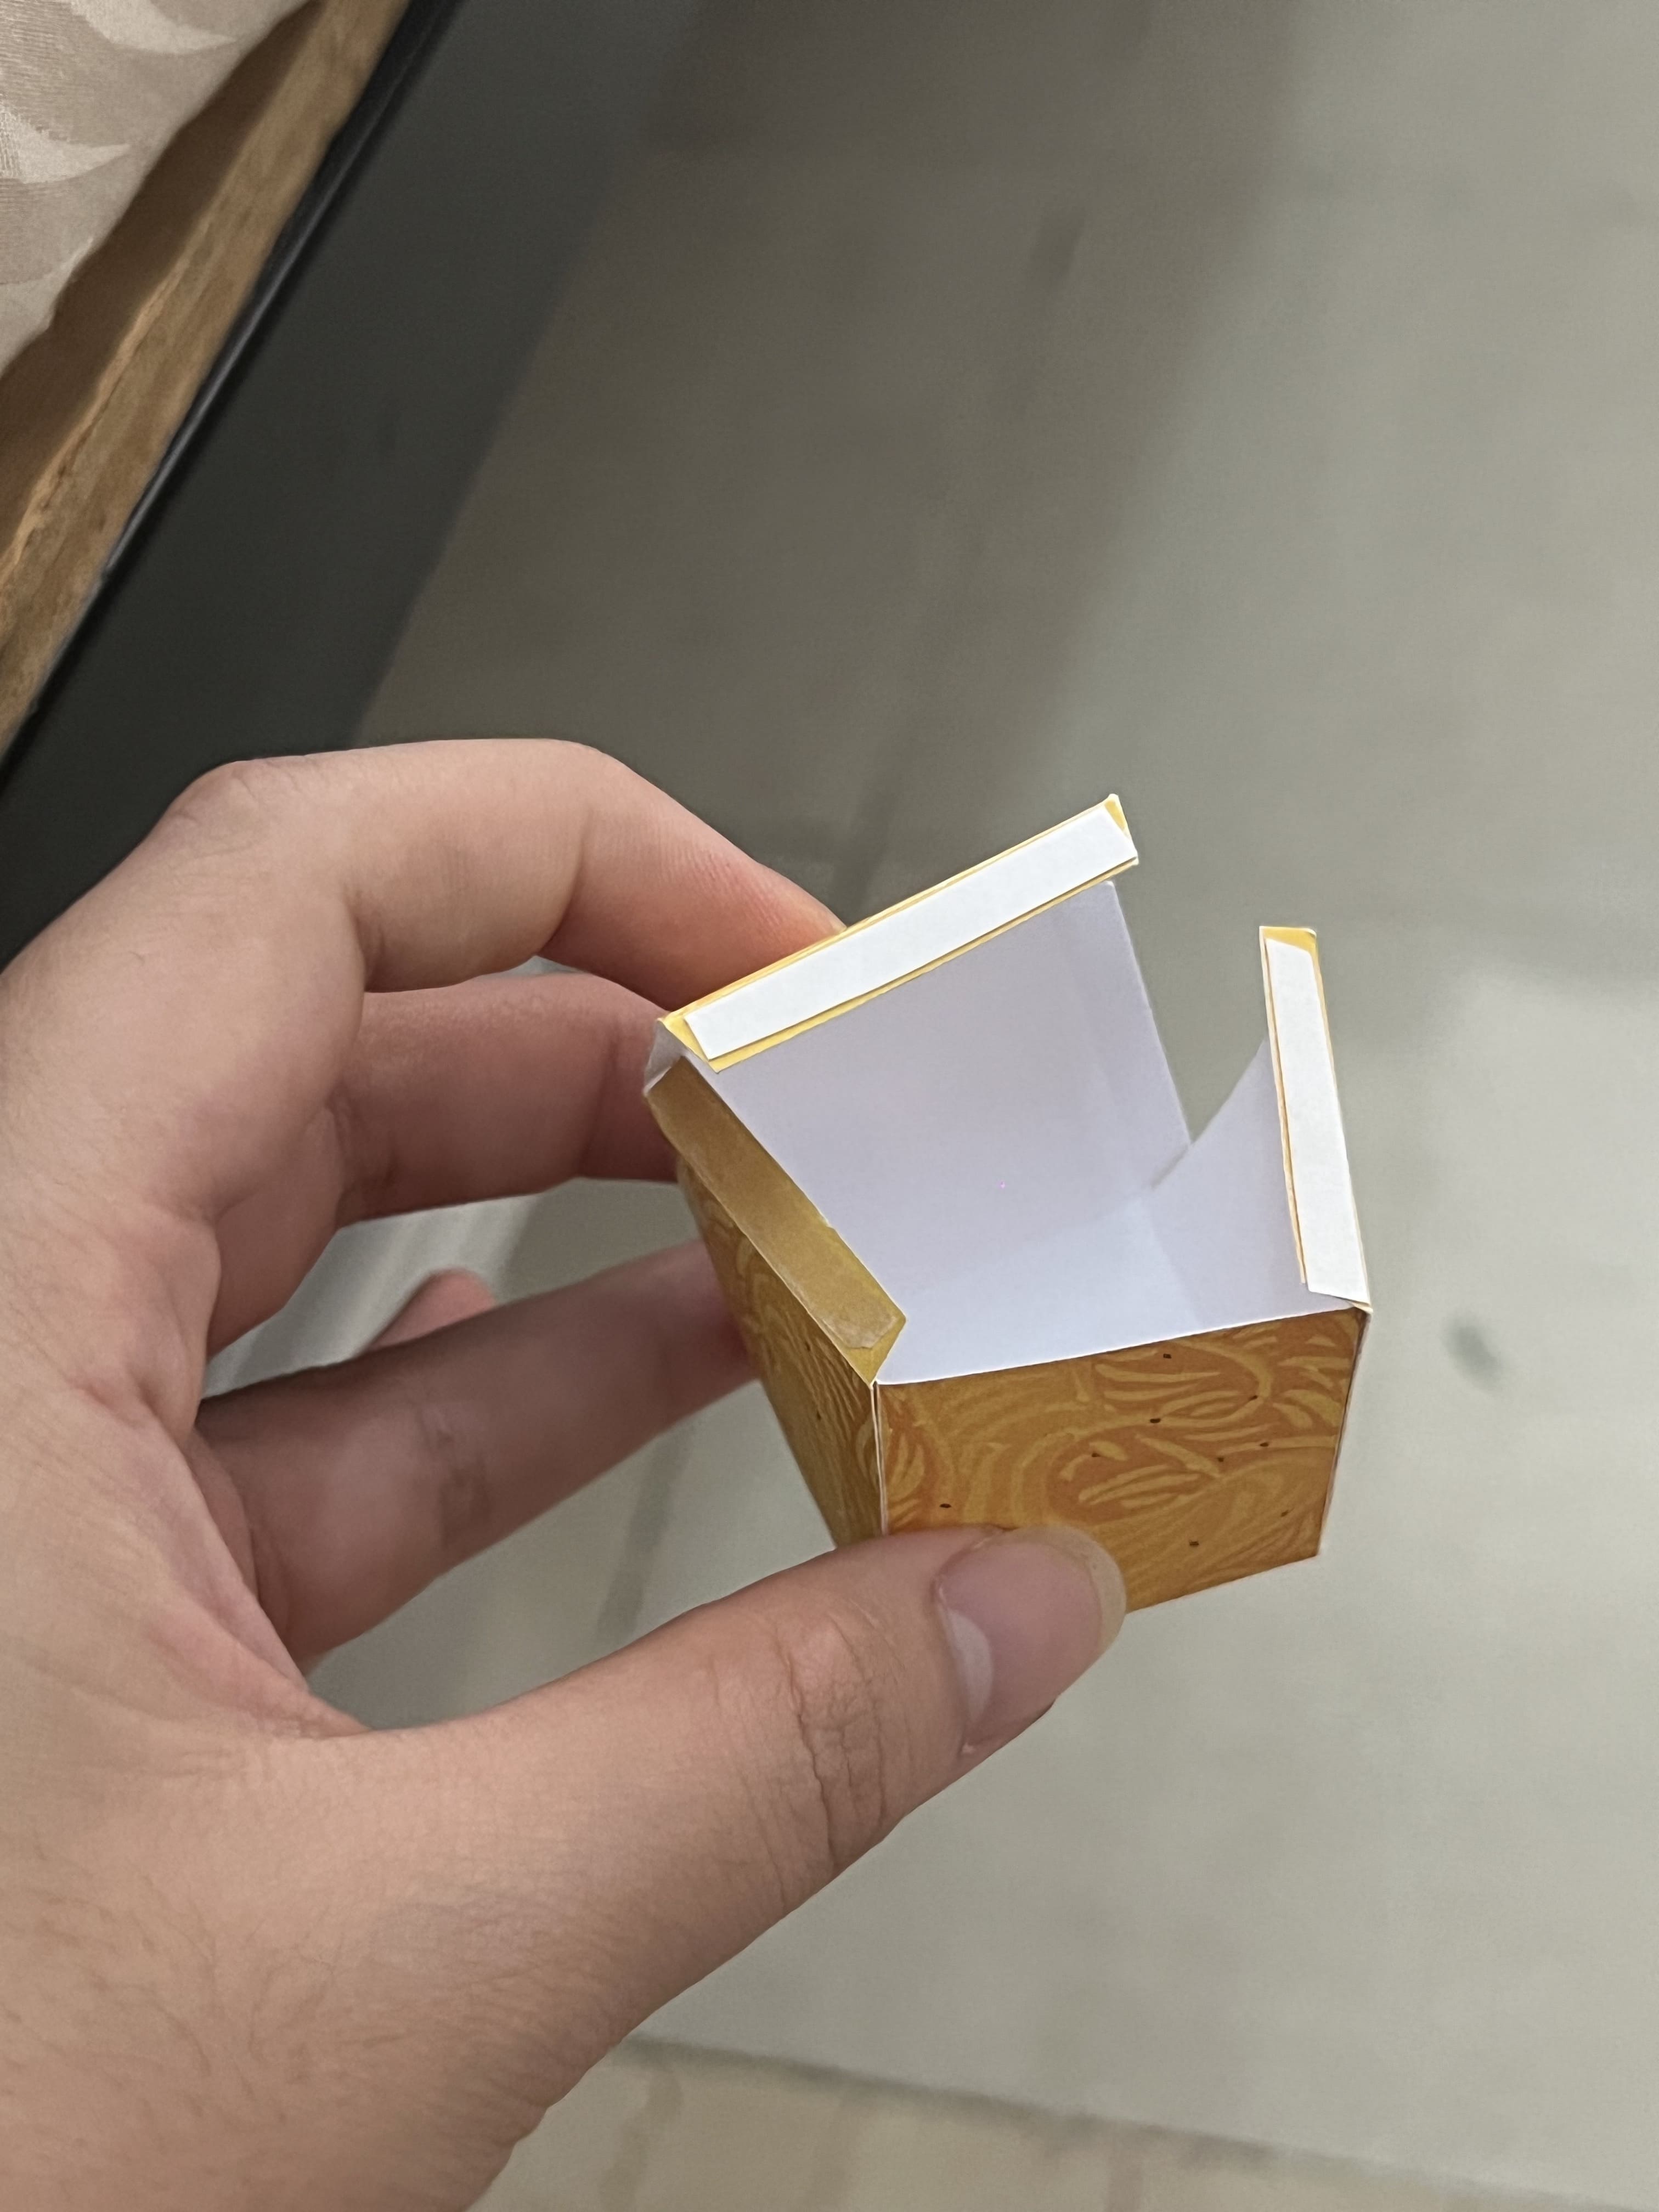
In the field of making physical artifacts, the choice of paper thickness has a very important meaning and can influence the outcome. Choosing the wrong paper thickness can disrupt efforts to achieve precision, resulting in less neat results. From the experimental results, thin paper provides smoother folding results and doesn’t cause many defects. Meanwhile,folding results using thicker paper is less smooth and easier to damage due to the scoring results.This underscores the importance of careful consideration in material selection, emphasizing that any misstep in this selection can impact the entire creative process. Excellence in creating work depends on the decisions made, which encourage careful consideration to ensure the perfect creation.
Despite the challenges posed, our visualization prowess continues to shine, transcending material limitations. This success underscores our capacity to innovate and adapt, creating impactful visualizations despite obstacles, directing our creativity towards meaningful outcomes.
